Audio Spectrum Analyzer
Black Cat Systems
Audio frequencies displayed for analysis.
The app displays audio frequencies up to 20 kHz on an iPad, iPhone, or iPod Touch. Users can adjust frequency span, FFT size, and apply filtering for smoothing.
Showing 1–20 of 1,000 ranked alternatives.
Black Cat Systems
Audio frequencies displayed for analysis.
The app displays audio frequencies up to 20 kHz on an iPad, iPhone, or iPod Touch. Users can adjust frequency span, FFT size, and apply filtering for smoothing.
PZ MOBILE LIMITED
Visualize sound with real-time waveforms
Visualizes audio signals in real time with a spectrum display. Connects to microphones or hi-Z devices via mini-jack. Measures sound frequency and amplitude. Adjusts visual settings for different sound sources. Displays real-time audio analysis data.

Loop-Sessions.LLC.
Analyze and display waveform
Real-time analysis displays waveform and amplitude simultaneously. Users can switch between portrait and landscape modes. Options to configure waveform and display. Adjustable FFT size and window function for precise frequency analysis.

bismark LLC
Real-time audio spectrum analyzer with FFT.
The app analyzes audio input in real-time using FFT. It displays the frequency spectrum with options for graph scale, FFT window, decay time, and amplitude offset.

Vlad Polyanskiy
Analyze and display FFT plots
Analyze in real time with octave band and FFT plots. Display sound levels in decibels and noise ratings. Choose linear or logarithmic scales. Adjust window functions and track maximum values.

Marina Polyanskaya
Analyze and visualize frequencies
Analyze frequencies with a real-time display. Adjust and visualize sound levels across different frequency ranges. Export analysis data and compare signals for accuracy. Calibrate equipment for optimal performance.

Chrystian Vieyra
Measure, record, and analyze data
Measure acceleration, orientation, and motion with built-in sensors. Record and analyze real-time data for experiments. Detect and generate sound tones. Visualize audio waveforms. Export measurements and graphs for scientific use.


Marina Polyanskaya
Analyze and visualize frequency
Analyze in real time with octave band and FFT measurements. Visualize frequency spectra and measure sound levels. Export data and compare measurements across sessions.


DEXUS Pawel Krzywdzinski
Analyze signals in real time
Analyze signals with real-time spectrogram, spectrum, and oscilloscope visualizations. Identify frequencies and measure response of equipment. Detect phonetic elements in speech and visualize animal calls. Check singer’s formant for vocal analysis.

New Ball s.r.o.
Record and analyze frequencies in real time
Realtime analyzer processes live input with Fast Fourier Transform and window functions. Record for offline analysis. Visualizer module displays frequency data from recorded files. Export analysis results and files.

Music Breath, OOO
Analyze sound and visualize frequencies
Measure sound levels with real-time precision. Analyze harmonics using multichannel FFT with adjustable parameters. Display graphical representations of audio data. Utilize AI to identify sound sources and analyze environments.

BetaMatters Limited
Analyze audio in real time
Analyze audio in real time with RTA bar and line graphs, FFT, and spectrogram views. Display peak and current dB levels. Choose linear or logarithmic scales. Adjust octave settings and access a sleek, functional interface.

DEXUS Pawel Krzywdzinski
Analyze ultrasounds in real time.
The app provides real-time spectrum, spectrogram, oscilloscope, and octave RTA analysis. It offers visual representations of ultrasounds with adjustable settings and allows for transposed listening and slowed-down playback of inaudible sounds.
Richard Barber
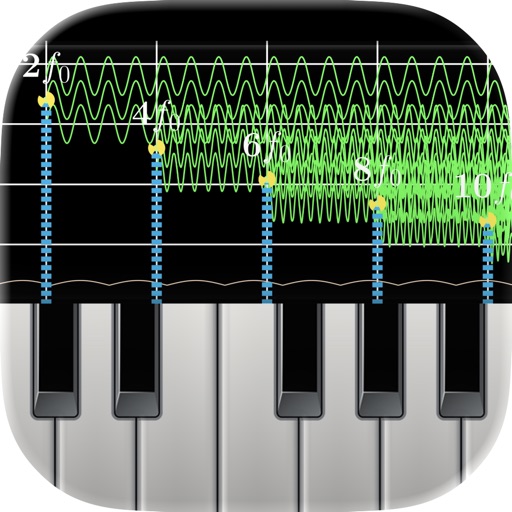
Analyze audio and visualize piano inharmonicity
Monitor audio in real time with low-latency processing. View waveform oscilloscopes and frequency spectra. Analyze piano inharmonicity and tuning accuracy. Capture and inspect raw waveforms for music and acoustics.
Apps are ranked by functional similarity, category fit, rating confidence, and popularity.