
bismark bs-spectrum
bismark LLC
Real-time audio spectrum analyzer with FFT.
The app analyzes audio input in real-time using FFT. It displays the frequency spectrum with options for graph scale, FFT window, decay time, and amplitude offset.

Analyze and display waveform
Real-time analysis displays waveform and amplitude simultaneously. Users can switch between portrait and landscape modes. Options to configure waveform and display. Adjustable FFT size and window function for precise frequency analysis.
Showing 1–20 of 1,000 ranked alternatives.
bismark LLC
Real-time audio spectrum analyzer with FFT.
The app analyzes audio input in real-time using FFT. It displays the frequency spectrum with options for graph scale, FFT window, decay time, and amplitude offset.


Marina Polyanskaya
Analyze and visualize frequencies
Analyze frequencies with a real-time display. Adjust and visualize sound levels across different frequency ranges. Export analysis data and compare signals for accuracy. Calibrate equipment for optimal performance.


Ashraf Thoppukadavil
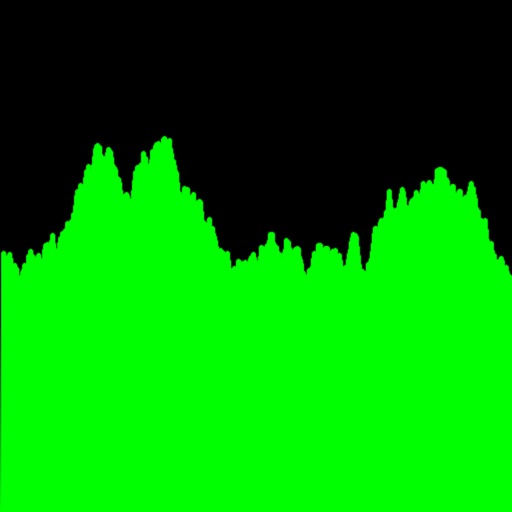
Track noise levels in real time
Measure levels in decibels using the device’s microphone. Display real-time audio frequency and dB readings. Apply filters for specific frequency and dB ranges. Share measurements via Messages, Email, WhatsApp, Notes, and other apps.


Vlad Polyanskiy
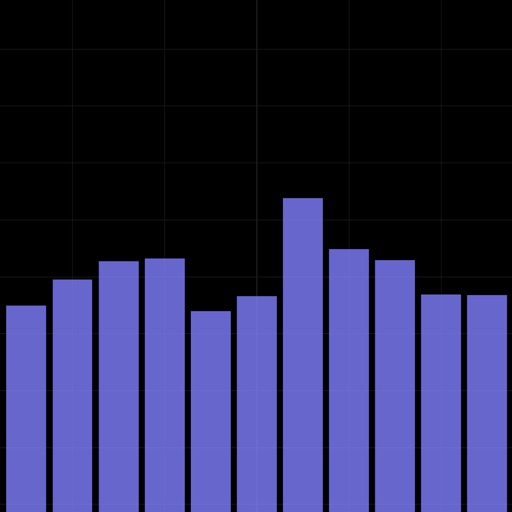
Analyze and display FFT plots
Analyze in real time with octave band and FFT plots. Display sound levels in decibels and noise ratings. Choose linear or logarithmic scales. Adjust window functions and track maximum values.
DEXUS Pawel Krzywdzinski
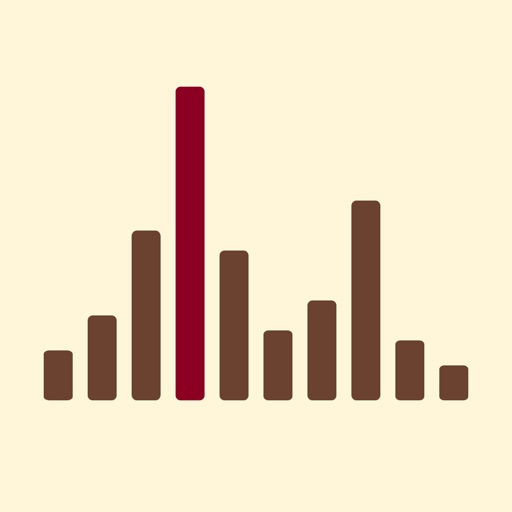
Analyze frequency response
Analyze signals with real-time octave RTA. Display frequency response using RMS values across full, 1/3, 1/6, and 1/12 bands. Measure SPL in dBFS. Support FFT with adjustable window sizes. Sample at 44.1kHz, 48kHz, or 96kHz.
Dmitriy Kharutskiy
Analyze waves in real time
Analyze spectra in real time using a microphone. Display waveforms and FFT data with adjustable frequency scales. Measure noise levels for approximate readings. Adjust FFT size for varying frequency accuracy.

Andrew Smith
Record , analyze , test speakers
AudioTools offers SPL measurement, RTA analysis, FFT visualization, and speaker polarity testing. Includes a generator, scope, CLF viewer, and recorder. Allows adding optional modules for advanced acoustic analysis and customization.


SkyPaw Co., Limited
Measure levels accurately
Measure sound levels using dBA and dBC scales. Detect levels accurately with pre-calibrated sensors. Log and analyze data. Set sound level alerts. Export measurements for review.

Dominik Seibold
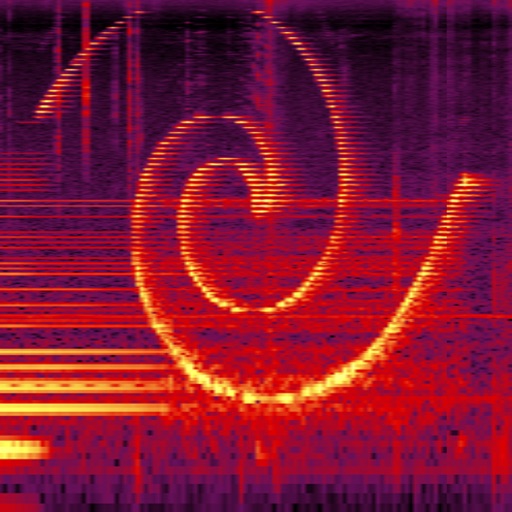
Analyze sound and visualize spectra
Perform real-time spectral analysis of sounds. View images with adjustable FFT-resolutions, frequency and amplitude scales, and color schemes. Save and share spectrograms. Access bode plot modes with averaging and maximum calculations.
Nalin Savaliya
Measure noise and display values
Measures environmental noise and displays values through a gauge and graph. Shows current noise reference and min/avg/max levels. Allows device-specific calibration. Displays data in multiple formats.

Apps are ranked by functional similarity, category fit, rating confidence, and popularity.