
PhotoMath Solver AI: MathBox
RLAM FZCO
Solve problems with a
Solve problems by taking photos of typed or handwritten equations. Receive step-by-step solutions with explanations. Check homework and study for exams. Access 24/7 assistance.
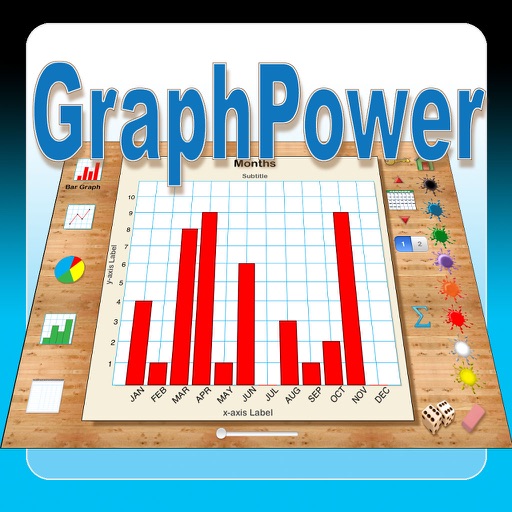
Develop skills in reading graphs.
The app offers an educational tool for data analysis and graph interpretation. Students can create bar graphs, line graphs, circle graphs, and histograms on their iPads, with options for titles, labels, and scales.
Showing 21–40 of 1,000 ranked alternatives.
RLAM FZCO
Solve problems with a
Solve problems by taking photos of typed or handwritten equations. Receive step-by-step solutions with explanations. Check homework and study for exams. Access 24/7 assistance.
Ron Avitzur
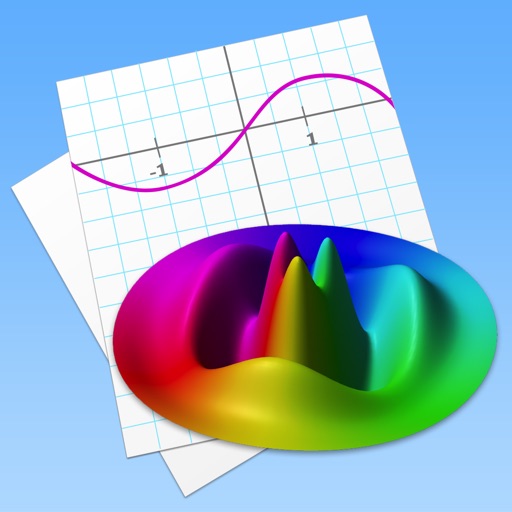
Graph functions and visualize equations
Allows users to plot functions, implicit relations, and parametric curves. It supports 3D graph visualization in AR. Features include inequality plotting, vector fields, and coordinate transformations.


Himanshu Nag
Edit equations, functions, calculate measurements
Perform advanced calculations with formula editing and recalculation. Generate graphs for complex equations. Support for engineering and computations. Includes graphing capabilities for mathematical functions.


Taro Horiguchi
And edit graphs and spreadsheets
Line, pie, and bar graphs for data visualization. Edit and format spreadsheets with cell manipulation and formula support. Export charts and tables in various file formats.

PASCO scientific
Collect, visualize, and analyze STEM data.
The app collects, visualizes, and analyzes STEM learning data. It graphs live sensor data in real time and connects to wireless Bluetooth Smart sensors.

Inter Platforms Pty Ltd
Solve questions and chat with AI tutor
Allows users to take photos of math problems and receive step-by-step solutions. It can plot graphs of equations. Users can chat with an AI tutor for homework and assignment .

SkyPaw Co., Limited
Measure levels accurately
Measure sound levels using dBA and dBC scales. Detect levels accurately with pre-calibrated sensors. Log and analyze data. Set sound level alerts. Export measurements for review.


Texas Instruments
Solve equations and graph functions
Solve equations and perform algebraic manipulations. Graph functions and analyze data. Enter and analyze statistical models. Calculate derivatives and integrals. Export results and share solutions.

AppSeed, Incorporated.
Create pie, bar, and line graphs quickly
Create Pie, Bar, and Line graphs with simple data input. Customize titles, colors, and labels. Save images to device or share on social media. Edit past charts using built-in history. All core features are free to use.

Leon Huang
Monitor search rankings for keywords
Monitor websites' search engine rankings for specific keywords using real Google Search results. Track Top 100 search results and view Alexa data and backlinks. Sort keywords by ranking, alphabetically, or manually.

Ronny Weidemann
Graph equations in 2D, 3D, and 4D
Allows users to graph mathematical equations in 2D, 3D, and 4D with animations. It supports vectors, matrices, trigonometric functions, and complex numbers. Users can plot cartesian, polar, and parametric equations.


Mindware Consulting, Inc
Play and track progress
Practice mental skills with - based on cognitive tasks. Track progress with score history and performance graphs. Convert scores to a standardized scale for benchmarking. Play trial with limited attempts.

Apps are ranked by functional similarity, category fit, rating confidence, and popularity.