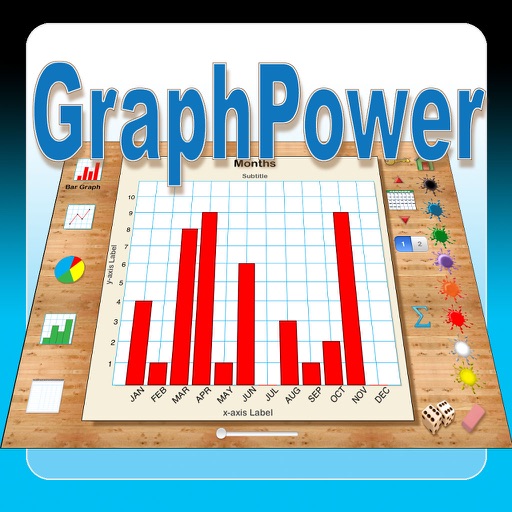
The app offers an educational tool for data analysis and graph interpretation. Students can create bar graphs, line graphs, circle graphs, and histograms on their iPads, with options for titles, labels, and scales.
by Ventura Educational Systems★ 1.01 ratingsEducation$2.99Data updated 2026-10-04
Graph functions, equations, and curves in 2D and 3D. Calculate derivatives, integrals, and roots. Create tables of values and solve equations. Construct and analyze polygons, circles, and conics. Use Augmented Reality to explore 3D objects.
Download and upload speeds for WiFi and mobile networks. Measure ping and jitter for latency. View real-time connection graphs. Track past results with detailed charts and averages. Troubleshoot or verify ISP-provided claims.
Track items with manual entry and editing. Monitor count changes over time using a graph. Export data as CSV for external reporting. Filter time series data on the graph.
Solve problems with step-by-step explanations. Generate 2-D and 3-D visualizations. Perform algebra, calculus, and integration calculations. Take a picture of equations for input. Export solutions and graphs.
View school news and class schedules with locations. Check current grades and assignments with teacher comments. See upcoming tasks and performance graphs. Access attendance and homework details.
Perform calculations with a freeform canvas and responsive results. Link numbers for instant updates. Calculate tips and discounts. View full history with clear formatting. Adjust settings for precision and layout.
The app supports data collection from various Vernier sensors and offers multiple data analysis features. Users can graph and analyze sensor data, perform calculations, and export results for reports.
Organize and ideas using plain text Markdown files. Customize toolbar and themes. View in graph format. Access iCloud vaults. Pin sidebar for tablet use. Use quick actions and community plugins.
The app solves quadratic equations, inequations, and functions. It offers a 3D rotating model of a parabola and a graph mixer for exploring function graphs.
Track habits by marking tasks as completed. View progress with a percentage success rate. Set reminders and receive nudges to stay consistent. Sync across devices and review long-term achievement metrics.
Solve mathematical equations with AI-powered step-by-step guidance. Graph functions and analyze results. Perform complex calculations and receive real-time explanations. Export solutions and share results. Sync with devices for continued use.
Measure sound levels using the built-in microphone. Display decibels in dBA with a digital readout. Show minimum, average, and maximum values. Visualize sound levels with a graph line.