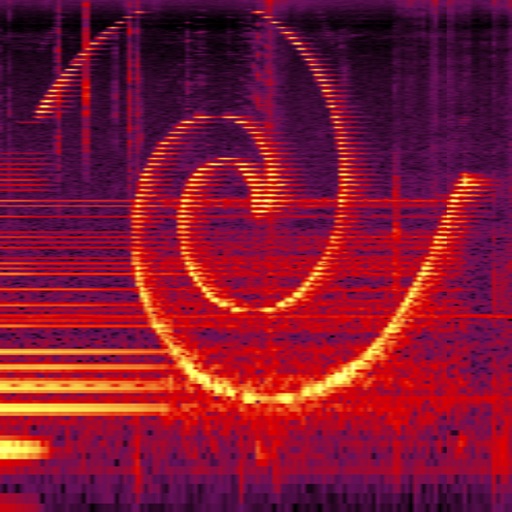
Visualize real-time audio frequencies with a spectrogram and spectrum analyzer. Adjust sample rate and frequency resolution. Identify sound frequencies, measure vocal range, and analyze audio input.
by Oxford Wave Research Ltd.★ 3.174 ratingsEducationFreeData updated 2026-09-08
The app provides a real-time spectrogram and spectrum analyser display. Users can visualise audible frequencies, measure tones, and obtain visual feedback of speech frequencies.
Measure acceleration, orientation, and motion with built-in sensors. Record and analyze real-time data for experiments. Detect and generate sound tones. Visualize audio waveforms. Export measurements and graphs for scientific use.
Analyze frequencies with a real-time display. Adjust and visualize sound levels across different frequency ranges. Export analysis data and compare signals for accuracy. Calibrate equipment for optimal performance.
Analyze audio in real time with RTA bar and line graphs, FFT, and spectrogram views. Display peak and current dB levels. Choose linear or logarithmic scales. Adjust octave settings and access a sleek, functional interface.
Perform real-time spectral analysis of sounds. View images with adjustable FFT-resolutions, frequency and amplitude scales, and color schemes. Save and share spectrograms. Access bode plot modes with averaging and maximum calculations.
Real-time analysis displays waveform and amplitude simultaneously. Users can switch between portrait and landscape modes. Options to configure waveform and display. Adjustable FFT size and window function for precise frequency analysis.
Analyze in real time with octave band and FFT measurements. Visualize frequency spectra and measure sound levels. Export data and compare measurements across sessions.
Measure sound levels with a precision instrument featuring a . Calibrate against professional dB meters. Log noise data and set decibel thresholds. Display real-time sound level readings and frequency analysis.
Analyze signals with real-time spectrogram, spectrum, and oscilloscope visualizations. Identify frequencies and measure response of equipment. Detect phonetic elements in speech and visualize animal calls. Check singer’s formant for vocal analysis.
Realtime analyzer processes live input with Fast Fourier Transform and window functions. Record for offline analysis. Visualizer module displays frequency data from recorded files. Export analysis results and files.
The app provides real-time spectrum analysis using Fourier Transform. It offers various display modes, including octave bands and spectrograms, with multi-touch magnification and noise cancellation features.
Generate sound waves and customize audio frequencies
Create and visualize sound waves with frequency control from 0Hz to 22,000Hz. Measure decibels to assess noise levels. Emit ultrasonic frequencies to deter insects. Toggle between light and dark interface themes.
View real-time EEG brainwave data with professional-grade spectrogram and frequency breakdown. Track raw microvolts and absolute wave values. Split data by brain regions or sensors. Access accelerometer and gyroscope data.
Record and playback heart and bodily sounds using the device's microphone. Visualize sounds in real-time with time and frequency domain displays. Share recorded waveforms with others.