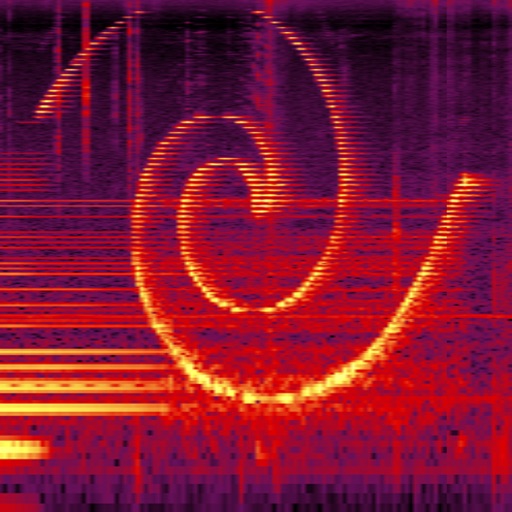
Apps Like Spectrogram Pro (with super-smooth 60Hz update) for iPhone and iPad
Analyze sound and visualize spectra
Perform real-time spectral analysis of sounds. View images with adjustable FFT-resolutions, frequency and amplitude scales, and color schemes. Save and share spectrograms. Access bode plot modes with averaging and maximum calculations.
by Dominik Seibold★ 3.827 ratingsMusic$3.99Data updated 2026-09-30
Analyze audio in real time with RTA bar and line graphs, FFT, and spectrogram views. Display peak and current dB levels. Choose linear or logarithmic scales. Adjust octave settings and access a sleek, functional interface.
Real-time analysis displays waveform and amplitude simultaneously. Users can switch between portrait and landscape modes. Options to configure waveform and display. Adjustable FFT size and window function for precise frequency analysis.
ToneBoosters displays real-time , spectrum, and goniometer visuals. It processes microphone input for audio analysis. Supports AUv3 plugin format for integration with compatible host apps.
Measure sound levels with a precision instrument featuring a . Calibrate against professional dB meters. Log noise data and set decibel thresholds. Display real-time sound level readings and frequency analysis.
Measure acceleration, orientation, and motion with built-in sensors. Record and analyze real-time data for experiments. Detect and generate sound tones. Visualize audio waveforms. Export measurements and graphs for scientific use.
The app provides real-time audio analysis for musicians and recording engineers. It enables portable, precision audio measurement and visualization for tasks like room or speaker tuning.
Analyze audio with and views. Display up to three seconds of audio data. Scroll and zoom to review audio history. Switch between stereo and mono modes. Overlay or view and separately. Identify frequencies and MIDI notes with frequency trigger mode.
Audio analysis tool for professionals and students. View frequency spectra with adjustable FFT sizes and averaging times. Customize plot color and input source. Scale and move plot with smooth animation. Utilize full audio range from built-in mic.
Analyze spectra in real time using a microphone. Display waveforms and FFT data with adjustable frequency scales. Measure noise levels for approximate readings. Adjust FFT size for varying frequency accuracy.
The app provides real-time spectrum analysis using Fourier Transform. It offers various display modes, including octave bands and spectrograms, with multi-touch magnification and noise cancellation features.
Realtime analyzer processes live input with Fast Fourier Transform and window functions. Record for offline analysis. Visualizer module displays frequency data from recorded files. Export analysis results and files.
Measure sound levels with real-time precision. Analyze harmonics using multichannel FFT with adjustable parameters. Display graphical representations of audio data. Utilize AI to identify sound sources and analyze environments.
Record and playback heart and bodily sounds using the device's microphone. Visualize sounds in real-time with time and frequency domain displays. Share recorded waveforms with others.
Measure sound pressure levels precisely and easily.
The app transforms an iOS device into a sound level meter, measuring sound pressure levels. It offers features like Apple Watch support, Health app integration, and frequency analysis tools.