Apps Like Spectrogram Pro (with super-smooth 60Hz update) for iPhone and iPad
Analyze sound and visualize spectra
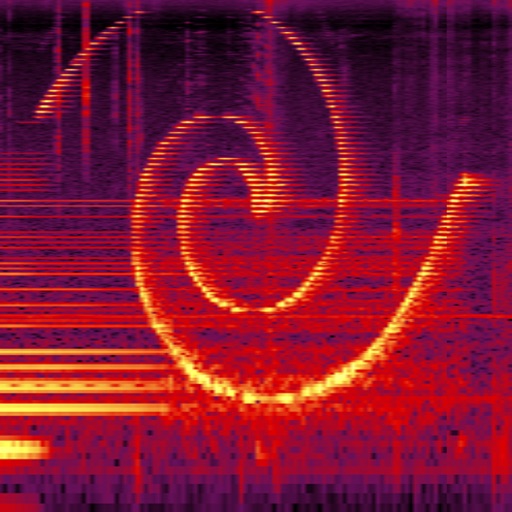
Perform real-time spectral analysis of sounds. View images with adjustable FFT-resolutions, frequency and amplitude scales, and color schemes. Save and share spectrograms. Access bode plot modes with averaging and maximum calculations.
by Dominik Seibold★ 3.827 ratingsMusic$3.99Data updated 2026-09-08
Monitor audio levels with real-time FFT analysis and automatic gain control. Detect peak frequencies and lower-frequency clarity using chirp Z transform. Predict aircraft noise up to four minutes ahead. Track dBFS and dBA levels with biquad filters.
Analyzes device motion using accelerometers and gyroscope. Displays time series data and frequency spectra via FFT. Supports external USB accelerometer. Applies Hamming window and removes DC bias. Tracks three-axis movement with 0.02g sensitivity.
Visualizes audio signals in real time with a spectrum display. Connects to microphones or hi-Z devices via mini-jack. Measures sound frequency and amplitude. Adjusts visual settings for different sound sources. Displays real-time audio analysis data.
Allows users to take photos of math problems and receive step-by-step solutions. It can plot graphs of equations. Users can chat with an AI tutor for homework and assignment .
Play short daily to improve mental sharpness and problem-solving skills. Choose from 50 mini- across six categories: awareness, adaptability, reflex, reasoning, precision, and patience. Access additional after watching a video.
Solve equations and graph functions with advanced math support. Perform calculus operations and matrix calculations. Access detailed tutorials and a comprehensive user manual. Export results and share calculations.
Take photos of problems or input equations to get instant solutions. View step-by-step explanations to understand solving methods. Correct answers and detailed breakdowns are provided for homework assistance.
Allows users to plot functions, polar, and parametric graphs. Users can edit equations in the graph editor and view graphs. Features include tracing, finding intersections and extrema, displaying derivatives, and adding tangents.
Solve mathematical equations and visualize results in 2D and 3D. Plot cartesian, polar, spherical, and parametric functions. Animate equations and vector fields. Find intersections of functions. Support for complex functions.