Analyzes audio using Fast Fourier Transform to display amplitude vs. frequency graphs. Displays detailed spectral analysis in octaves. Supports iOS microphone or external microphones for accurate measurements.
by Andrew Smith★ 4.06 ratingsMusic$10.99Data updated 2026-09-08
Displays sound waveforms and spectra using Fourier transform. Identifies frequency characteristics and detects peaks. Supports pinch zoom gestures for detailed analysis. Assists in sound adjustment and howling prevention.
Measure and display real-time frequency spectrum with Spectrum RTA. Calibrate monitor levels using the Level Meter. Determine optimal EQ presets with EQ Recommendation. Align monitors for accurate sound with Monitor Align.
The app provides a real time Spectrum Analyser, a Scope to display waveforms, an SPL Meter, and a Signal Generator. Users can view audio spectrums, waveforms, sound pressure levels, and generate sine waves or noise.
The app provides real-time audio analysis for musicians and recording engineers. It offers octave band analysis, FFT plots, and a spectrograph for sound visualization and measurement.
Analyze spectra in real time using a microphone. Display waveforms and FFT data with adjustable frequency scales. Measure noise levels for approximate readings. Adjust FFT size for varying frequency accuracy.
The app provides detailed audio analysis with multiple graph types and smoothing options. Users can overlay analysis data onto a real-time view and save recordings of sound levels and physical events.
Generate sound waves and customize audio frequencies
Create and visualize sound waves with frequency control from 0Hz to 22,000Hz. Measure decibels to assess noise levels. Emit ultrasonic frequencies to deter insects. Toggle between light and dark interface themes.
Track , distance, and direction with a digital and analog . Set custom distance values. Switch between portrait and landscape modes. Display in MPH, KM/H, and KNOTS. View altitude, maximum , and average with the Pro Pack.
Generate tones between 50 Hz and 30,000 Hz for testing or tuning. Track environmental noise levels and detect harmful sound pressure. from phone speakers using sound waves to restore sound clarity.
Measure sound levels with a decibel meter that displays current, maximum, and average values. View values on a gauge and in a graph. Set and track sound level measurements. Share results directly. No in- purchases required.
Measure sound levels using the built-in microphone. Display decibels in dBA with a digital readout. Show minimum, average, and maximum values. Visualize sound levels with a graph line.
Generate pure tones, frequencies, and waveforms for and headphone testing. Customize frequency ranges and noise types. Perform audio quality tests and analyze sound output. Save and share test results.
Measures environmental noise and displays decibel values in real time. Shows current noise reference and min/avg/max dB levels. Displays dB as a gauge and graph line. Saves measured records for later review.
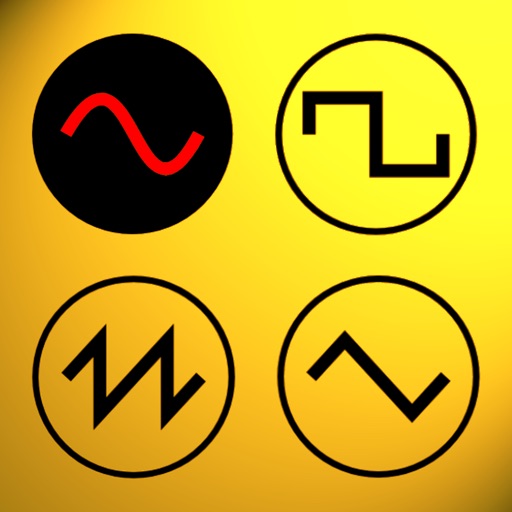
Udio tones with adjustable frequency, amplitude, and waveform selection. Choose from sine, square, sawtooth, and triangle waveforms. Test audio equipment, tune instruments, or use for sound therapy. Control settings through an intuitive interface.
Udio tones with customizable frequency settings from 15Hz to 22KHz. Choose between sine, square, sawtooth, and triangle waveforms. Create and save custom presets. Control playback from notification drawer, lock screen, or headset buttons.
Analyze in real time with octave band and FFT plots. Display sound levels in decibels and noise ratings. Choose linear or logarithmic scales. Adjust window functions and track maximum values.