Measure and display real-time frequency spectrum with Spectrum RTA. Calibrate monitor levels using the Level Meter. Determine optimal EQ presets with EQ Recommendation. Align monitors for accurate sound with Monitor Align.
by Gibson Pro Audio Corp.★ 4.140 ratingsMusicFreeData updated 2026-09-17
Analyze frequencies with a real-time display. Adjust and visualize sound levels across different frequency ranges. Export analysis data and compare signals for accuracy. Calibrate equipment for optimal performance.
AudioTools offers SPL measurement, RTA analysis, FFT visualization, and speaker polarity testing. Includes a generator, scope, CLF viewer, and recorder. Allows adding optional modules for advanced acoustic analysis and customization.
Analyze sound with FFT, RTA, and spectrogram views. Display vibration FFT and scope measurements. Measure magnetic field with scope and RMS. Adjust settings and customize analysis parameters. Export data and view real-time waveforms.
Measure sound levels with SPL meter and RT60 analysis for room reverberation. Analyze frequency spectra using spectrogram and octave modes. nd test audio signals with white/pink noise, sine, and sweep options.
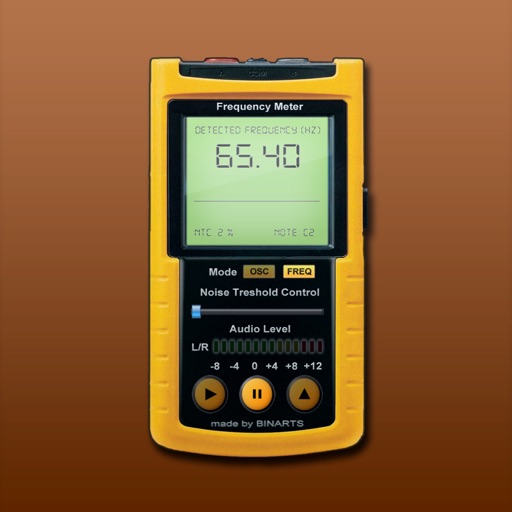
Measure and analyze audio frequencies with real-time scanning from internal or external microphone. Display audio level, noise level, range, current , oscilloscope, and spectrum analyzer. Calibrated for accuracy between 15 - 22500 Hz with +/- 0.
Measure sound levels with a precision instrument featuring a . Calibrate against professional dB meters. Log noise data and set decibel thresholds. Display real-time sound level readings and frequency analysis.
Real-time analysis displays waveform and amplitude simultaneously. Users can switch between portrait and landscape modes. Options to configure waveform and display. Adjustable FFT size and window function for precise frequency analysis.
Measure screen ripple and select eye-friendly devices
Measure ripple coefficient of light sources including LED, halogen, fluorescent, and incandescent lamps, as well as LCD and LED monitors. Display readings for visible spectrum radiation. Note that results may vary based on light source and frequency.
Analyze signals with real-time octave RTA. Display frequency response using RMS values across full, 1/3, 1/6, and 1/12 bands. Measure SPL in dBFS. Support FFT with adjustable window sizes. Sample at 44.1kHz, 48kHz, or 96kHz.
The app provides a real time Spectrum Analyser, a Scope to display waveforms, an SPL Meter, and a Signal Generator. Users can view audio spectrums, waveforms, sound pressure levels, and generate sine waves or noise.
Measure surfaces for levelness and angles with high precision. Calibrate quickly and save settings automatically. Accurate to one tenth of a degree. Supports Retina displays. Align picture frames or check table surfaces.
Edit by splicing, mixing, and cutting. Record with wired or wireless earphones. Adjust playback speed from 0.2 to 4 times. Balance left and right channels. Export edited files.
Measure sound levels with a professional-grade sound level meter. Display decibel readings, frequency analysis, and real-time data. Set sampling intervals, average measurements, and export results. Track maximum and minimum levels.
Measure sound levels with readings. Analyze sound frequency with spectrum visualization. Generate custom tones for testing or experimentation. Save and share measurement data.
Measure sound levels with a precision noise meter, including OSHA/NIOSH compliant dosimetry and impulsive noise detection. Display live spectrum and capture measurement snapshots. Email results and access hearing protection guidance.