Manage development at home with precise timing controls and access to standard development curves. Input type and chemistry to calculate optimal temperatures and times. Track development progress and save custom profiles for repeated use.
Manage amenities, report issues, and access workspaces
Manage workspace amenities by reserving equipment and reporting issues. Track work orders and access control settings. Update parking profiles and submit feedback to enhance workplace operations.
Create and manage lists of timers called "Cues" to track time for routine steps. Automatically start the next when one ends. Set timers for fitness exercises and breaks, productivity sessions with Pomodoro loops, or other timed tasks.
Edit photos with auto features, one-click optimization, and skin smoothing. Apply filters and stickers for enhanced visuals. Create custom grids and effects for selfies. Share edited photos directly.
Track time with technique and view detailed statistics. Store data in the cloud for backup. Play background white noise like ticking, Twitter sounds, or flowing water. Access an online study room for collaborative work and mutual supervision.
Create 3D mockups of t-shirts, hoodies, and coffee mugs. Choose from multiple colors for each product. Upload designs and apply them to mockups. Export high-quality images for presentations or sales.
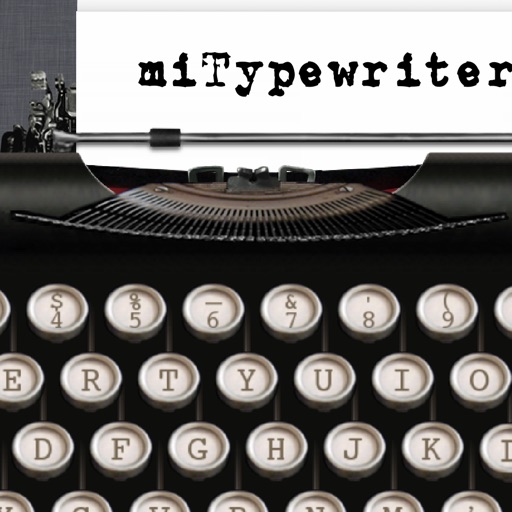
The app presents a typewriter interface on an iPhone or iPod Touch. Users can manage documents, email content as text or images, and utilize features like a backspace key and external keyboard support.
Edit and run Python 2.7 scripts with auto-completion, auto-indent, and syntax highlighting. Execute selected text from the editor or browser. Save files using templates. Support text, PDF, CHM, MP3, M4V, and ZIP file formats.
Learn and execute Python 3.5 scripts with auto-completion, code coloring, and auto-indentation. Run selected text or entire files. Save and open scripts in a built-in editor. Share code via file system.
Measure levels in your surroundings with real-time readings. Display minimum, average, and maximum values. Show current noise reference and detailed data. Visualize levels through a graph for better understanding.