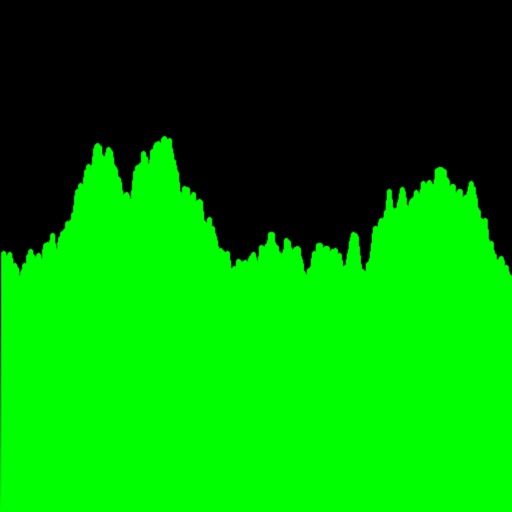
Audio Spectrum Analyzer
Black Cat Systems
Audio frequencies displayed for analysis.
The app displays audio frequencies up to 20 kHz on an iPad, iPhone, or iPod Touch. Users can adjust frequency span, FFT size, and apply filtering for smoothing.

Showing 1–20 of 1,000 ranked alternatives.
Black Cat Systems
Audio frequencies displayed for analysis.
The app displays audio frequencies up to 20 kHz on an iPad, iPhone, or iPod Touch. Users can adjust frequency span, FFT size, and apply filtering for smoothing.

bismark LLC
Real-time audio spectrum analyzer with FFT.
The app analyzes audio input in real-time using FFT. It displays the frequency spectrum with options for graph scale, FFT window, decay time, and amplitude offset.

Vlad Polyanskiy
Analyze and display FFT plots
Analyze in real time with octave band and FFT plots. Display sound levels in decibels and noise ratings. Choose linear or logarithmic scales. Adjust window functions and track maximum values.
DEXUS Pawel Krzywdzinski
Analyze signals in real time
Analyze signals with real-time spectrogram, spectrum, and oscilloscope visualizations. Identify frequencies and measure response of equipment. Detect phonetic elements in speech and visualize animal calls. Check singer’s formant for vocal analysis.

Marina Polyanskaya
Analyze and visualize frequencies
Analyze frequencies with a real-time display. Adjust and visualize sound levels across different frequency ranges. Export analysis data and compare signals for accuracy. Calibrate equipment for optimal performance.


Cox Communications, Inc.
View service details and manage your bill
View service details and manage bills by updating payment methods or making payments. Check data usage and receive outage alerts. Access support resources and contact agents for assistance.

Stefan Robl
Analyze, visualize, and synthesize audio signals
Oscilloscope mode displays real-time waveforms with automatic and single-shot triggering. Measures frequency, period, and amplitude automatically or manually. Spectrum analyzer mode identifies frequency components and amplitude levels.
Marina Polyanskaya
Analyze and visualize frequency
Analyze in real time with octave band and FFT measurements. Visualize frequency spectra and measure sound levels. Export data and compare measurements across sessions.

Dmitriy Kharutskiy
Analyze waves in real time
Analyze spectra in real time using a microphone. Display waveforms and FFT data with adjustable frequency scales. Measure noise levels for approximate readings. Adjust FFT size for varying frequency accuracy.

Hong Nguyen
Record, save, and share memos
Record with high-quality HD settings ranging from 8-41.1KHz sample rates. Save recordings as memos. Share files directly with others. Features include a simple interface for quick access and one-tap recording.
Vlad Polyanskiy
Measure sound levels and analyze frequencies
Measure sound levels with a precision instrument featuring a . Calibrate against professional dB meters. Log noise data and set decibel thresholds. Display real-time sound level readings and frequency analysis.

Loop-Sessions.LLC.
Analyze and display waveform
Real-time analysis displays waveform and amplitude simultaneously. Users can switch between portrait and landscape modes. Options to configure waveform and display. Adjustable FFT size and window function for precise frequency analysis.

ONYX 3
Real-time audio analysis for sound.
The app provides real-time audio analysis for musicians and recording engineers. It enables portable, precision audio measurement and visualization for tasks like room or speaker tuning.
Apps are ranked by functional similarity, category fit, rating confidence, and popularity.