The app captures student behavioral observation data through simple checkboxes. It automatically maintains timed intervals and generates reports with percentage statistics, graphs, and charts for visual data communication.
The app allows an iOS device to communicate with IP-enabled dataloggers for field maintenance. It supports viewing and collecting data, setting the clock, and downloading programs.
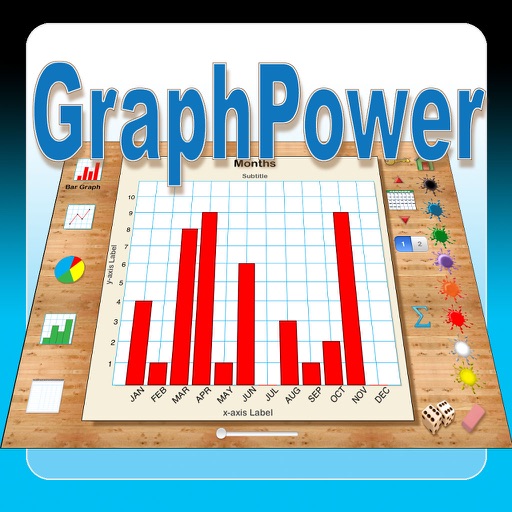
The app offers an educational tool for data analysis and graph interpretation. Students can create bar graphs, line graphs, circle graphs, and histograms on their iPads, with options for titles, labels, and scales.