Follow developers on GitHub to view their latest activities and contribution graphs in a unified feed. Access individual developer profiles for detailed information. Navigate to project repositories and track code changes in real time.
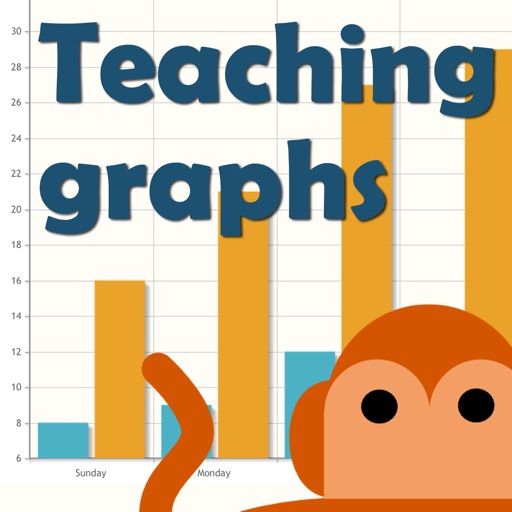
The app teaches basic graphs and data interpretation. It includes activities to read and make picture graphs, Venn and Carroll diagrams, bar, pie, and line charts.
Calculate linear interpolation and extrapolation between data points. Input values to determine corresponding results. Display the linear equation based on provided data. Perform calculations with a minimal interface.
The app displays pitch deviation with LED indicators and sound frequency on a graph. It offers automatic or manual note selection and a wide detection range from A0 to C8.
The app analyzes word pronunciations to suggest a likely region of origin within Switzerland. Users input how they say specific words, and the app provides an estimated origin based on dialectal variations.
Access GitLab issues, merge requests, and pipelines
Access GitLab instance data by entering base URL and personal access token. View pipelines, merge requests, and issues. Perform actions like checking statuses and navigating through project boards. Syncs with GitLab API for real-time updates.
Create vector drawings with speed and flexibility.
The app provides an intuitive tool for creating vector graphics such as flowcharts, technical drawings, and drafts. It offers speed and flexibility with customizable tools for precise alignment and adjustable elements.