Explore data, visualize insights, and discover new
Explore geographic data and development insights through interactive maps and visualizations. Access public-domain datasets on infrastructure, population, and economic indicators. Filter and analyze data by region, sector, and time frame.
by The World Bank Group★ 4.510 ratingsReferenceFreeData updated 2026-09-09
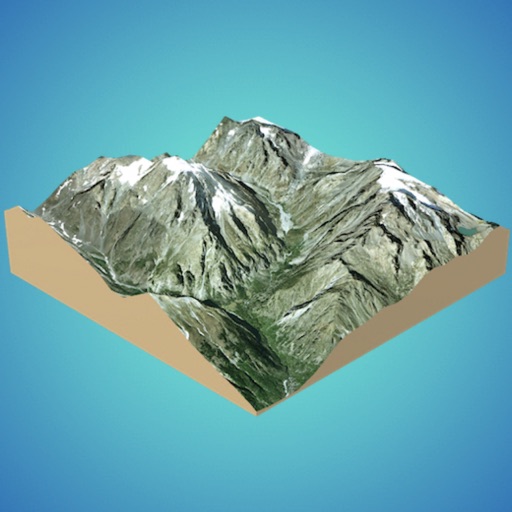
Create 3D models from online sources like Bing Maps or local cloud points. Export data as CSV, TXT, STL, or OBJ. Modify models by cutting, scaling, and animating. Calculate surface areas and volumes in real-world units.
Access eLearning modules to develop skills in observability, automation, and data analysis. Track progress with personalized learning paths. Earn certifications upon completing courses. Sync learning history across devices.
Access all awards, chips, and stars with their requirements and patch designs. Search for specific items and plan activities efficiently. Share resources and connect with other leaders through social media and the website.
Learn mindfulness techniques, set productivity goals, and track habit progress through interactive lessons and challenges. Complete quests to earn rewards and unlock new content. Access live sessions and advanced modules with a paid subscription.
The app helps young children explore size, quantity, and numbers through playful interaction. It encourages comprehension using visuals and audio prompts, with reinforcement based on Applied Behavior Analysis principles.
Visualize and reconstruct images with Fourier Transform
Converts images to grayscale for analysis. Automatically resizes images to 256x256. Removes mean values for normalization. Visualizes Fourier transform in real-time. Decomposes and reconstructs images from frequency components.