Play maze with 90 levels and a fairytale storyline. Help Piggy navigate labyrinths to defeat wolves and dragons. Solve puzzles to progress and play rock-paper-scissors to win challenges.
Create and structure plots for novels, manga, movies, dramas, and scripts. Organize character relationships and manage flow with visual tools. Generate scene outlines and track incidents. Includes scriptwriting templates and planning guides.
Create apps without coding by describing features in plain English. Build user interfaces, set workflows, and integrate services. Publish and manage apps directly from the platform. No developer skills required.
Create and edit musical scores with multi-staff and multi-voice editors. Add notes and chords using the Pencil tool. Transpose sections with vertical drag. Use On-Screen piano for quick composition. Select and adjust elements with the Select tool.
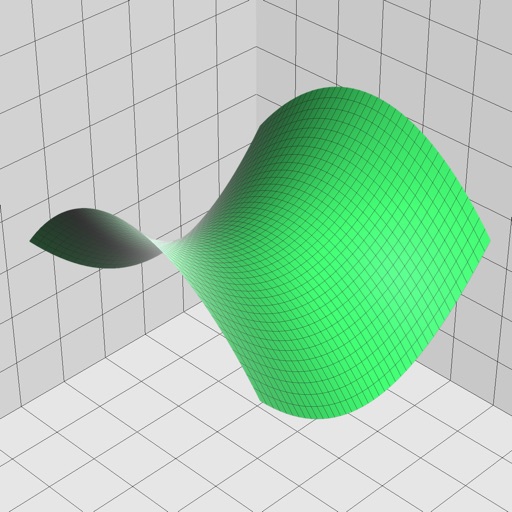
Enter and edit equations in mathematical notation. Visualize 2D and 3D graphs of explicit, implicit, and inequality equations. Adjust settings for display and analysis. Save and share calculations.
Teaches numbers, counting, colors, and shapes through interactive games. Includes animated elements and challenges to develop attention, logic, and memory. Features multiple levels with engaging storytelling and voiceover.
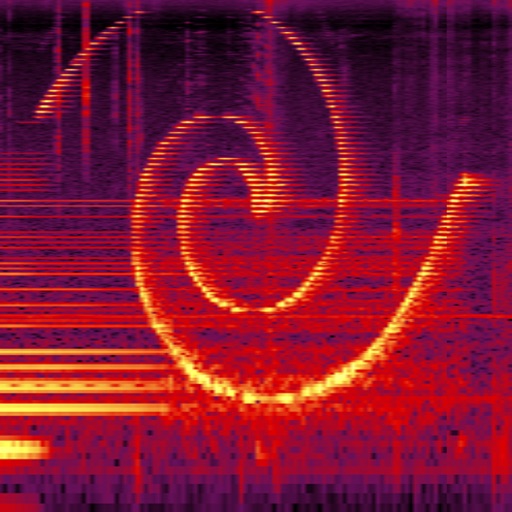
Perform real-time spectral analysis of sounds. View images with adjustable FFT-resolutions, frequency and amplitude scales, and color schemes. Save and share spectrograms. Access bode plot modes with averaging and maximum calculations.
Convert units across 17 categories with 398 options. Switch between currencies using daily updated exchange rates. Access converter on Apple Watch for quick and conversions.
Solve math problems, answer questions, and plot graphs using a proprietary computer algebra system. Access Apple's Foundation Language Models for additional assistance. Perform real-time equation solving and graphing without an internet connection.
Allows users to add and view on a map or sort them by name, distance, or date. Users can zoom in or out to focus on specific points. can be plotted and compared for proximity. Errands can be mapped and organized for the day.
Allows users to enter and save datasets, generate summary , calculate z-scores, and create boxplots and histograms. It includes a textbook with formulas, exercises, examples, and visualizations of key statistical concepts.
Documents, receipts, and notes as multipage PDFs. Auto-detect document edges and straighten pages. Add, resize, move, and delete signatures on any page. Email, upload to cloud services, and store files securely.
Track radio propagation between any two global locations. Estimate HF conditions using forecasting tools. View solar activity data and propagation graphs. Set alerts for optimal listening times. Share forecasts with other users.
View upcoming and candidates at local, state, and federal levels. Participate in polls to express opinions. Compare candidates based on shared beliefs. Access voter research tools to inform decision-making.