AudioTools offers SPL measurement, RTA analysis, FFT visualization, and speaker polarity testing. Includes a generator, scope, CLF viewer, and recorder. Allows adding optional modules for advanced acoustic analysis and customization.
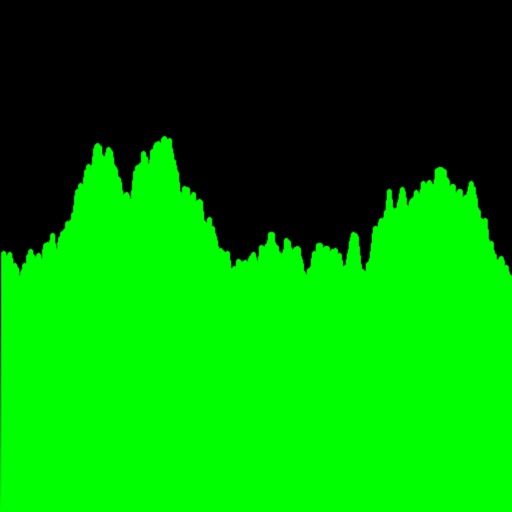
Audio analysis tool for professionals and students. View frequency spectra with adjustable FFT sizes and averaging times. Customize plot color and input source. Scale and move plot with smooth animation. Utilize full audio range from built-in mic.
Analyze frequencies with a real-time display. Adjust and visualize sound levels across different frequency ranges. Export analysis data and compare signals for accuracy. Calibrate equipment for optimal performance.
Realtime analyzer processes live input with Fast Fourier Transform and window functions. Record for offline analysis. Visualizer module displays frequency data from recorded files. Export analysis results and files.
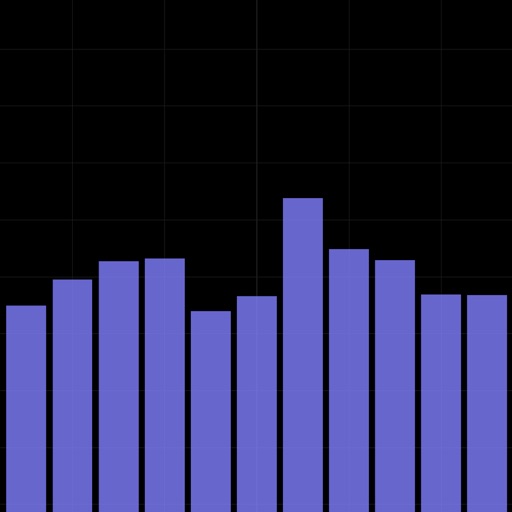
Analyze signals with real-time octave RTA. Display frequency response using RMS values across full, 1/3, 1/6, and 1/12 bands. Measure SPL in dBFS. Support FFT with adjustable window sizes. Sample at 44.1kHz, 48kHz, or 96kHz.
The app provides real-time audio analysis for musicians and recording engineers. It enables portable, precision audio measurement and visualization for tasks like room or speaker tuning.
Measure sound levels with SPL meter and RT60 analysis for room reverberation. Analyze frequency spectra using spectrogram and octave modes. nd test audio signals with white/pink noise, sine, and sweep options.
Analyze audio in real time with and FFT measurements. Visualize frequency response and adjust settings for room or speaker tuning. Export measurement data for further analysis.
The app displays audio frequencies up to 20 kHz on an iPad, iPhone, or iPod Touch. Users can adjust frequency span, FFT size, and apply filtering for smoothing.
The app offers sound pressure level (SPL) measurement with industry standard response times and weighting functions. It also provides a real-time audio analyzer with selectable bandwidths and FFT block sizes.
Monitor sound levels with a crystal clear SPL meter. Analyze audio in real time using a spectrograph. Access professional tools like Real Time Analyzer for accurate measurements and adjustments.
Analyzes audio using Fast Fourier Transform to display amplitude vs. frequency graphs. Displays detailed spectral analysis in octaves. Supports iOS microphone or external microphones for accurate measurements.
The app provides detailed audio analysis with multiple graph types and smoothing options. Users can overlay analysis data onto a real-time view and save recordings of sound levels and physical events.
Real-time analysis displays waveform and amplitude simultaneously. Users can switch between portrait and landscape modes. Options to configure waveform and display. Adjustable FFT size and window function for precise frequency analysis.
The app provides a real time Spectrum Analyser, a Scope to display waveforms, an SPL Meter, and a Signal Generator. Users can view audio spectrums, waveforms, sound pressure levels, and generate sine waves or noise.