Perform statistical tests, regression analysis, and text analysis on various data formats. Generate graphs and tables for t-tests, ANOVA, linear regression, and survival analysis. Visualize text data with cloud charts for customer feedback.
by Number Analytics LLC★ 5.03 ratingsProductivityFreeData updated 2026-09-06
Calculate with precision and unlimited stack depth
Perform financial calculations including loans, mortgages, and "what-if" scenarios. Calculate statistical functions. Use a 15-digit RPN interface with unlimited stack depth. Handle numbers within the range of 2^{-1022} to 2^{1024}.
Access property, ownership, and mortgage data for analysis. Filter data by location and criteria. View property transaction history. Calculate net proceeds. Track neighborhood trends with geographic tools. Share insights with clients.
Track mood and productivity through daily prompts and feedback. Set goals and receive AI-driven insights. Customize personality and engage in conversations. Monitor progress over time with statistical analysis.
Create a colorful dial keyboard with customizable colors for different groups. Edit background images by rotating, scaling, or moving them, and adjust blur. Set friend head images from a contact list.
Access real-time market data and AI-driven for cryptocurrency trading. Set up custom alerts for price changes and news. Generate trade suggestions based on historical trends and market sentiment.
Generate CSV files with customizable string lengths and element levels. Create encoded data using numeric values. View character encoding tables. Export results in plain text format.
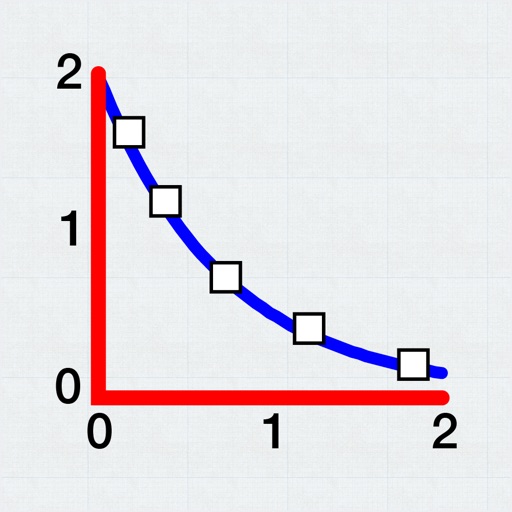
Allows users to plot and fit x, y data pairs. It supports curve fitting, value prediction, and kinetic data analysis. Data can be entered manually or imported from text or CSV files. Users can perform statistical analysis and generate graphs.