View the current phase with details like phase name, illumination percentage, and age. Explore a visual for the entire month. Track upcoming events and full dates. Share phase information with others.
Displays real-time , average , and maximum with unit options. Provides sensor data for weather, altitude, and device orientation. Offers customizable dashboards and waveform charts. Allows saving and exporting historical data in CSV format.
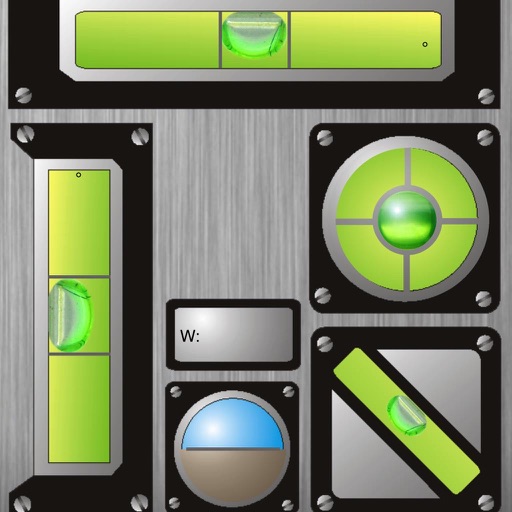
The app displays horizontal and vertical bubble levels, 45° indicators, and total angles. It also includes an artificial horizon and a ruler in cm and inches.