
mizutama Calendar
Shigeo Fukuda
Schedule and note each day with ease
A vertical with illustrated designs allows users to add daily memos, switch between heading-only and full text views, and attach up to five sticky notes per date.

Analyze transfer functions and system dynamics.
The app plots Bode and Nyquist diagrams for transfer functions. It visualizes impulse response and analyzes system stability, showing pole counts and encirclements.
Showing 161–180 of 1,000 ranked alternatives.
Shigeo Fukuda
Schedule and note each day with ease
A vertical with illustrated designs allows users to add daily memos, switch between heading-only and full text views, and attach up to five sticky notes per date.

Daniel Kuster
Edit code and generate plots remotely
Create and manage projects on iOS. Edit and execute code, generate results and plots via Verbosus. Access a dedicated server for computation. View and export plots directly from the .

Yuki Mori
Record , analyze stats, visualize performance
Record batting results to automatically calculate metrics like batting average and OPS. Visualize performance data with graphs and compare results across game formats. Export and analyze detailed statistics for individual games.


HUNG HSUN LIN
Measure magnetic fields and detect metals.
The app measures magnetic field strength and can function as a metal detector. It displays real-time data, supports multiple units, and allows customizable measurement settings with alerts.

Shigeo Fukuda
Manage daily memos and schedule notes
Manage daily schedules with a function for each day. Add sticky note stamps for date marking. Choose from over 30 sticker designs. View in vertical format for easy reading.

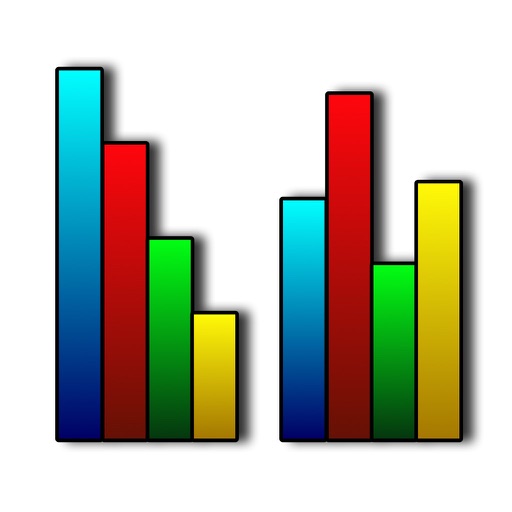
Alexandra Hamburg
Create bar charts and line charts
Create bar and line charts with intuitive tools. Modify chart designs and adjust settings for custom visuals. Print charts directly from iPhone or iPad via in- purchase.

Glindemann, Sennoun, Langer GbR
Factor into binomials
Enter coefficients a, b, and c to factor quadratic trinomials into binomials. Store calculation history and view detailed step-by-step solutions. Support positive and negative numbers, including decimals. Share final results. No advertisements.



RealByte
Track expenses, set budgets, manage accounts
Manage personal finances with budget tracking, expense categorization, and asset grouping. View data sorted by date, category, or asset group. Sync data via Wi-Fi or 3G. Edit and view financial records on PC.


Yuri Morozov
Graph functions in 3D and 2D
Graph functions in 3D Cartesian coordinates. Plot surfaces, lines, or dots with adjustable perspective, lighting, and rotation. Animate graphs along X, Y, or Z axes. Export tables of points sorted by X or Y values.

林青 刘
Track temperature, set alarms, and save data
Monitor food temperature in real time with a Bluetooth Low Energy connection. Access preset recipes for various meats. Set food-ready alarms and timers. View temperature data in a CSV file. Sync temperature graphs with smartphone apps.

Sensos, LLC
Test drive sensors and plot waveforms
Test drive Machine Condition Monitoring sensors by connecting and plotting Time Waveform graphs and Vibration Spectrum in Acceleration, dB, and Velocity. Auto-calibrate to each sensor. Adjust sampling rates and number of samples for data acquisition.


Apps are ranked by functional similarity, category fit, rating confidence, and popularity.