Track biomarkers, view trends, get recommendations
Track cardiovascular and cardiometabolic biomarkers over time. View lab results from Boston Heart Diagnostics as they arrive. Receive personalized recommendations for health improvement. Subscribe to regular blood testing through the .
by Boston Heart Diagnostics Corporation★ 5.02 ratingsMedicalFreeData updated 2026-09-06
Monitor heart rate and blood pressure for real-time health insights. Analyze sugar content in food for dietary awareness. Receive personalized health advice via AI. Track health metrics and set reminders for daily check-ins.
Browse a comprehensive library of common lab . View clinical laboratory values and accurate interpretations. Search for specific and review detailed descriptions. Help users remember lab values and understand test results.
Guide with real-time biofeedback using a camera. Perform paced , box , and other techniques. Monitor heart rate variability and stimulation. Track progress and improve focus, reduce stress, and support overall well-being.
Track workouts with detailed progress reports. Set fitness goals and receive personalized training plans. Monitor heart rate and calories burned during sessions. Sync data across devices and view performance analytics.
Track health metrics and view progress over time. Access lab results from CLIA certified labs. Consult with healthcare professionals. Set and monitor wellness goals. Receive educational materials on health conditions.
Healthcare professionals can assess cardiovascular using calculators for primary and secondary prevention. Features include SCORE2, ASCVD, SMART, and DIAL tools. Calculators adapt to population-specific needs.
Record readings with timestamp and category. View history charts to track trends. Set reminders for regular monitoring. Share readings with healthcare providers. Receive educational tips on managing .
Learn about type 2 inflammation's role in and how biomarkers like eosinophil counts, FeNO, and IgE levels guide personalized treatment. Explore clinical evidence and treatment strategies for managing across diverse patient populations.
Track levels by logging glucose readings before and after meals, and at bedtime. Analyze meal photos with AI to get a 0–100 spike risk score and receive tips. View daily trends and averages through a calendar interface.
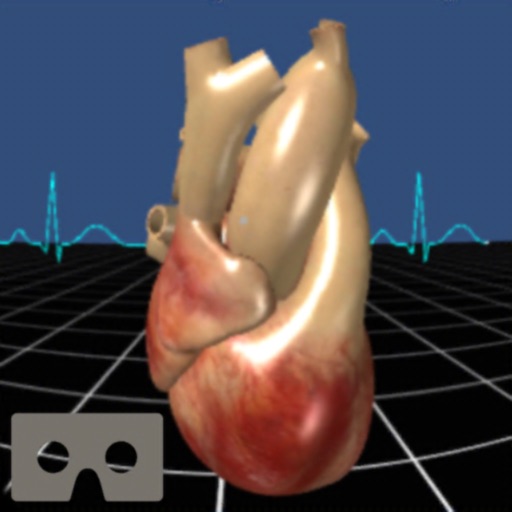
Explore 3D models of the human to study anatomy and cardiovascular systems. Interact with the Human Model to examine treatment options, simulate medical devices, and analyze real-world conditions.
Record heart rate and blood pressure manually or through integration with wearable devices. View historical data and trends. blood levels with manual input. Set reminders for measurements and sync data across devices.
Measure rate by placing your finger on the camera for real-time readings. Track blood pressure and with precise measurements. Monitor cardiovascular health with easy-to-use interfaces and store data for ongoing analysis.