Graph functions in 3D Cartesian coordinates. Plot surfaces, lines, or dots with adjustable perspective, lighting, and rotation. Animate graphs along X, Y, or Z axes. Export tables of points sorted by X or Y values.
by Yuri Morozov★ 4.813 ratingsEducationFreeData updated 2026-09-06
Create art with layer editing tools including adding, deleting, duplicating, hiding, sorting, and grouping layers. Use blend modes and transparency settings. Access various tools like pen, eyedropper, eraser, and selection.
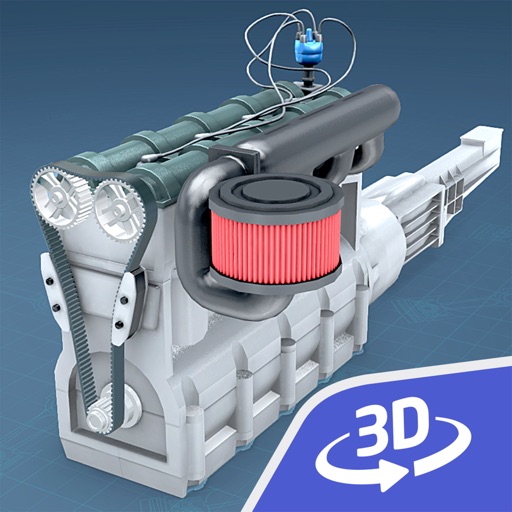
Explore a 4-stroke through interactive 3D animations. Rotate and zoom to view internal components. Learn about cycles with labeled diagrams. Available in multiple languages for educational use.
The app allows users to create and modify cubic Bézier curves with up to four connected segments. It displays the convex hull and a C1 continuity hint for segment connections.
The app analyzes a singing voice and displays the pitch over time on a music scale. Users can visualize pitch, singing features like vibrato, and playback recordings.
Learn SQL syntax through code examples that explain how to combine tables, sort grouped data, and identify SQL Server data types. Access over 150 tested code samples from books and online resources.
Explore with swipe and touch to view details like name, symbol, atomic number, mass, Lewis dots, and radius. Colors indicate classification, melting point, boiling point, outermost orbital, and ion radius.
Collect and analyze data from up to six sensors at once. Perform statistical analysis on full or selected datasets. Choose from ten curve fitting functions to plot and display formulas. Show error bars based on sensor specs or trial statistics.