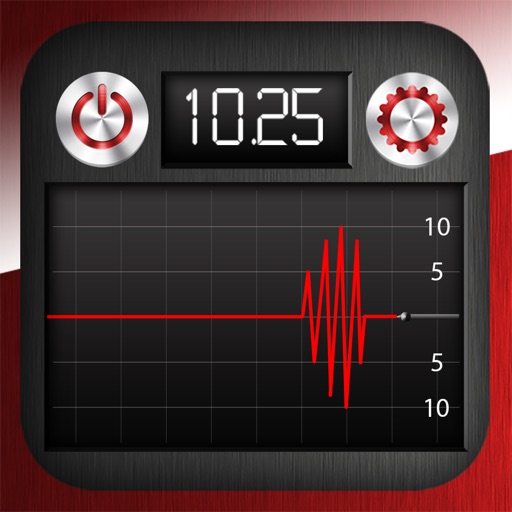
Test drive Machine Condition Monitoring sensors by connecting and plotting Time Waveform graphs and Vibration Spectrum in Acceleration, dB, and Velocity. Auto-calibrate to each sensor. Adjust sampling rates and number of samples for data acquisition.
by Sensos, LLC★ 5.03 ratingsUtilitiesFreeData updated 2026-10-05
Converts between 160 currencies and 350 physical . Users can save favorite conversions for quick access. Offline exchange rates are updated every half-hour and stored if successful.
Manage irrigation by setting up and calibrating OtO devices. Define watering zones and schedule maintenance. Monitor system status and adjust settings remotely.
Record audio meetings, interviews, or calls with unlimited length and number of recordings. Transcribe content automatically and organize notes with searchable text. Share transcriptions and integrate with other apps for seamless collaboration.
Monitor CPU frequency and reduction details. View real-time CPU performance metrics. Check screen resolution and size. Display battery design capacity. Track network IP and speed. Identify GPU type and extensions.
The app records, plots, and exports time, frequency, and non-linear HRV features. It includes experience sampling, RR-interval correction, activity monitoring, and location tracking.
Sound levels with SPL metrics including current average, peak, average maximum, and absolute maximum. Display graph histograms for level changes. Save measurements and reset maximum values by tapping. Support upside down orientation for easy use.
Real-time analysis displays waveform and amplitude simultaneously. Users can switch between portrait and landscape modes. Options to configure waveform and display. Adjustable FFT size and window function for precise frequency analysis.
Monitor vehicle performance with real-time data from sensors. View diagnostic trouble codes and sensor values. Access full vehicle history reports. Control engine functions like throttle and ignition. Save and export diagnostic logs.
Measure sound levels with a precision instrument featuring a . Calibrate against professional dB meters. Log noise data and set decibel thresholds. Display real-time sound level readings and frequency analysis.
Manage inventory from acquisition to disposal with real-time tracking and vehicle valuation. Log transactional history, monitor vehicle status, and syndicate vehicles during appraisal. Generate reports and streamline merchandising processes.
Monitor vehicle health with real-time diagnostics. Inspect ignition, exhaust, and electronic systems for faults. View fault codes with three severity levels. Clear stored fault codes from the ECU. Analyze driving patterns to improve efficiency.
The app monitors pitch velocity for a child, opposing pitcher, or MLB player. It tracks score, inning, outs, and ball/strike count from stadium stands.
Measure sound levels using the built-in microphone. Display decibels in dBA with a digital readout. Show minimum, average, and maximum values. Visualize sound levels with a graph line.
Convert vibration units including velocity, acceleration, and displacement. Switch between Hz and CPM for frequency. Convert displacement between mils and microns with options for RMS, 0-peak, and peak-peak.
Record audio, analyze sensor data, generate spoken
Record and analyze environmental data such as electromagnetic fields, light, and proximity changes. Convert sensor inputs into spoken words using a database of over a thousand words. Detect subtle movements and vibrations without user interaction.
Measure vibrations using phone sensors to detect seismic activity or body tremors. Display readings on the modified Mercalli intensity scale. Calibrate the to set maximum values between 10-11. Provide reference comparisons for earthquake vibrations.
Explore scientific concepts through interactive experiments in biology, physics, and chemistry. Use device sensors like camera, microphone, and motion sensor for real-time data collection.
The app displays exact measurements from its sensors and overlays leveling information on the camera. It allows users to calibrate the vertical and horizontal vials.
Sound levels with SPL metrics including current average, peak, average maximum, and absolute maximum. Display graph histograms for adjustable settings. Save measurements and reset max values by tapping. Support upside down orientation for easy use.