Track trading progress by saving individual trades and viewing a graph of average percentage gains. Analyze performance trends and monitor gains over time.
by Jackson Tubbs★ 4.530 ratingsFinanceFreeData updated 2026-10-02
Analyze charts using AI to identify patterns and market trends. View multiple timeframes and assets. Get insights on strategies and price movements. Customize alerts and save annotations. Export reports and share findings.
Track payouts from stocks, ETFs, and mutual funds in a single dashboard. Analyze income growth over time. Manage multiple portfolios and assess performance. Set reminders for dates. Export data for tax purposes.
Manage forex trades with real-time charts, technical analysis tools, and order execution. Access market news, daily trading signals, and position sizing software. Set risk management alerts and track performance metrics.
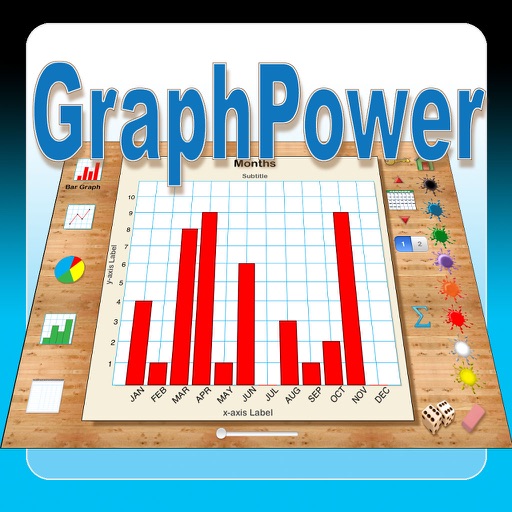
The app offers an educational tool for data analysis and graph interpretation. Students can create bar graphs, line graphs, circle graphs, and histograms on their iPads, with options for titles, labels, and scales.
Tracks currency performance across multiple time frames. Displays recent data to identify top and weakest performing currencies. Calculates performance for 28 currency pairs every 5 minutes. Measures average or total change in price or pips.
Track and analyze data including rankings, prices, sales volume charts, and cap. Access project analytics for investment insights. Monitor price trends and compare assets. Set alerts for price changes and activity updates.