Create and visualize graphs with up to 20,000 edges. Analyze paths, flows, centralities, clustering, and cliques. Import larger graphs for extended analysis. Export results and view statistical summaries.
by Marc De Block★ 0.00 ratingsProductivityFreeData updated 2026-09-06
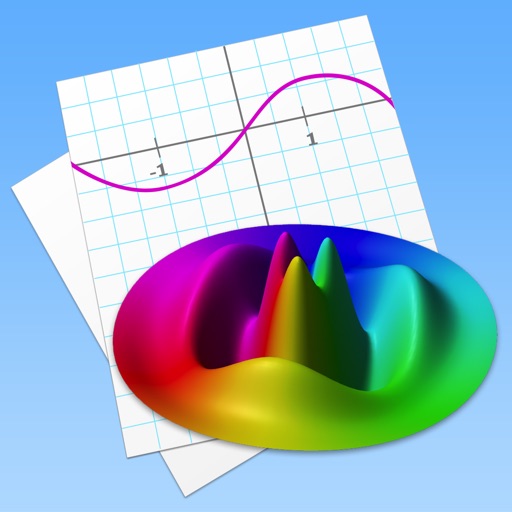
Allows users to plot functions, polar, and parametric graphs. Users can edit equations in the graph editor and view graphs. Features include tracing, finding intersections and extrema, displaying derivatives, and adding tangents.
Measure sound levels using dBA and dBC scales. Detect levels accurately with pre-calibrated sensors. Log and analyze data. Set sound level alerts. Export measurements for review.
Create and edit 3D models using 25 built-in primitive shapes. Import and export models in various formats. Adjust geometry with precision tools. View models in 3D and 2D perspectives. Add textures and materials for realistic rendering.
Learn through animated explanations and interactive simulations. Explore sorting techniques like Bubble Sort and Merge Sort. Dive into clustering and encryption concepts. Test understanding with Sim Mode features.
Create drawings with Apple Pencil support. Use grid or lined backgrounds. over existing images. Save square images. Add widgets to showcase drawings on the home screen. Enable multitasking and multi-window features on iPadOS.
Perform complex calculations with root, power, trigonometric, and logarithmic functions. Calculate factorials and double factorials. Draw graphs, use four memory blocks, insert constants, and make notes.
Track daily, weekly, and monthly progress toward goals. Visualize achievements with graphs and calendars. Set reminder notifications for accountability. Add passcode protection for privacy. Reset progress for new goals.
Daily personalized training offers a 4-game workout targeting memory, problem-solving, math, and focus. Games adapt based on performance. Includes 24 scientifically designed games for cognitive skill development.
Create and manage with spaced repetition scheduling. Add text, images, and audio. Review cards with customizable intervals. Export decks and sync with desktop versions. Support for multiple languages and custom templates.
Allows users to plot functions, implicit relations, and parametric curves. It supports 3D graph visualization in AR. Features include inequality plotting, vector fields, and coordinate transformations.
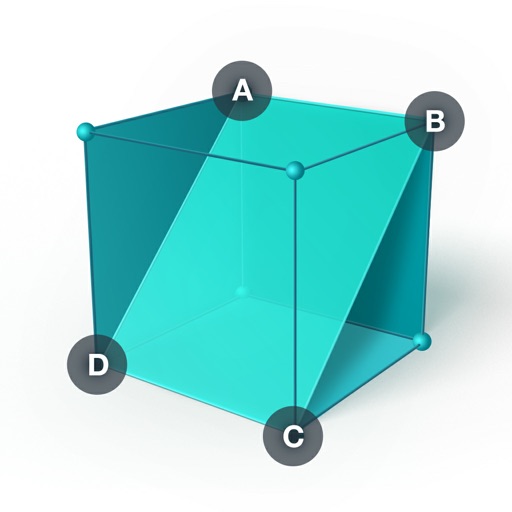
Create and manipulate 3D geometric . Measure angles and distances. Explore properties of solids and their relationships. Solve math problems involving . Visualize perpendicular and parallel lines. Apply the Pythagorean Theorem in 3D space.
Perform calculations with a freeform canvas and responsive results. Link numbers for instant updates. Calculate tips and discounts. View full history with clear formatting. Adjust settings for precision and layout.
Track habits by marking tasks as completed. View progress with a percentage success rate. Set reminders and receive nudges to stay consistent. Sync across devices and review long-term achievement metrics.
Identify species by uploading photos or images of trees or leaves. Use machine learning to analyze and provide accurate results. Access detailed information on characteristics, habitat, and uses.