Manage files with drag-and-drop organization. Access a flashlight with adjustable brightness. Use a calculator, note taker, and screen recorder. Includes calendar, timer, and widget tools. Sync data across devices.
Measure atmospheric pressure using the device's barometric sensor. Determine elevation with GPS-based altimeter. Access a ruler, surface level, metronome, stopwatch, timer, and seismometer. Includes flashlight.
The app provides a collection of 13 measuring tools and a flashlight. It includes a barometer, altimeter, compass, teslameter, metronome, stopwatch, timer, seismometer, plumb bob, surface level, spirit level, and ruler.
Measure acceleration, orientation, and motion with built-in sensors. Record and analyze real-time data for experiments. Detect and generate sound tones. Visualize audio waveforms. Export measurements and graphs for scientific use.
The app offers tools for home decoration, picture alignment, and angle measurement. It can also be used for slope projection and checking the verticality of partitions or furniture.
Track routes, find waypoints, and navigate offline
Navigate outdoors with offline GPS maps and real-time augmented reality. Track waypoints and custom locations. Use a gyrocompass, speedometer, altimeter, and inclinometer. Find celestial bodies and measure angles.
The app measures angles and inclinations for various applications. It can be used for home decoration, car inclination checks, and measuring slopes of roofs, stairs, floors, or roads.
Perform basic arithmetic operations including addition, subtraction, multiplication, and division. Access scientific functions for advanced calculations. Convert units between different measurement systems.
Measures angles and incline using device sensors. Users can align objects horizontally or vertically. The displays real-time angle readings and allows calibration. It supports multiple orientation modes for precise leveling.
Measure angles with touch or camera modes. Tap the screen to set points and calculate angles. Capture images for instant analysis. Customize measurement tools and save multiple angles simultaneously. Sync measurements across devices.
The app offers basic and scientific calculator modes, a universal converter for numerous units, and multitasking capabilities. Users can view calculation history, edit input, and customize the appearance with various skins.
Measure lengths with a ruler supporting metric and imperial units. Detect ambient noise levels using a decibel meter. Use a protractor tool to measure angles via the camera. Calibrate screens for accurate color display.
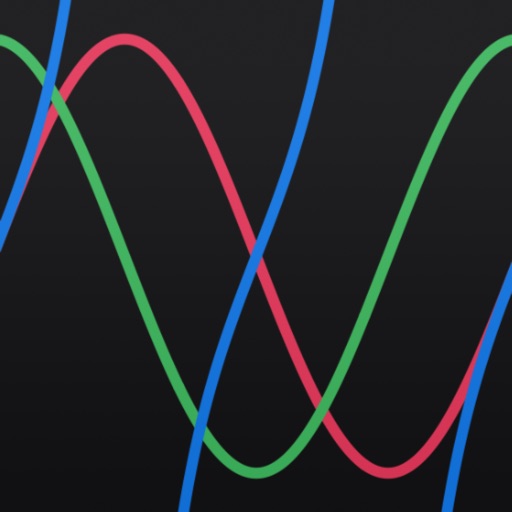
Understand trigonometric functions visually and easily.
The app provides visual representations of trigonometric functions, including wave graphs. Users can easily calculate and confirm the values of sine, cosine, tangent, cosecant, secant, and cotangent.
– uses AR to display a digital protractor and on the device screen. Users can precisely, calibrate the , and save measurements. The supports both indoor and outdoor use for accurate readings.
Monitor device with real-time data display and graphical charts. View text output and detailed descriptions for each sensor. Perform sensor tests and check parameters. Export data for analysis.