Add and retrieve information by taking photos of labels. Autofill details using image recognition. Get smart suggestions for regions and varietals. Add personal and search using multiple keywords. Store and sort by name and other details.
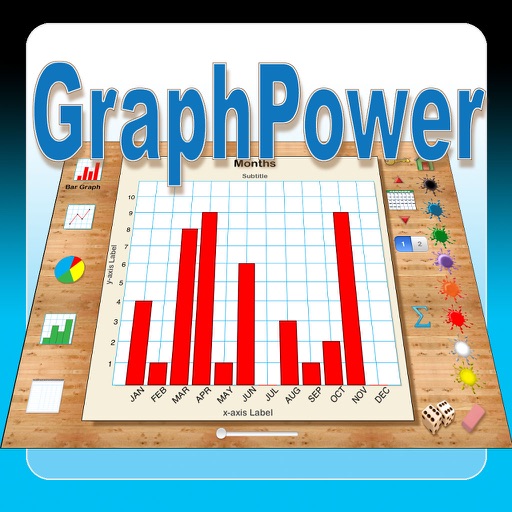
The app offers an educational tool for data analysis and graph interpretation. Students can create bar graphs, line graphs, circle graphs, and histograms on their iPads, with options for titles, labels, and scales.
Track cannabis plants and packages using barcode, camera, and RFID scanning. Record and report data to METRC systems. udit trails and print labels. Access features offline. Manage facility compliance and inventory.