
Dashboard for Wialon
View fleet reports and analyze KPIs
Gurtam Inc.
iPhone Screenshots


iPad Screenshots

Description
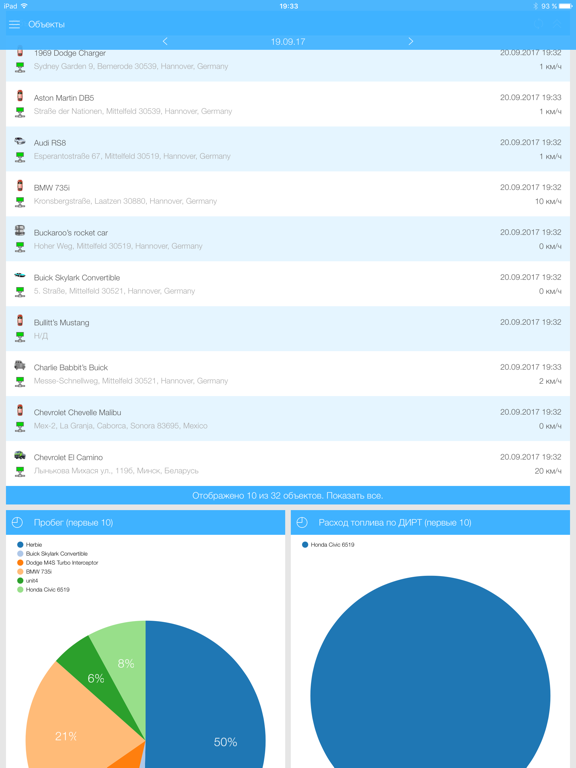
View fleet performance reports with visual graphics based on KPIs like mileage, fuel consumption, and speed. Analyze data from web-based Hosting. Track idling time, motor hours, and vehicle movement patterns. Export and compare metrics over time.
New Gurtam app allows fast and easy viewing of preliminary created comprehensive reports, based on your fleet’s KPIs.
Dashboard is an easy and effective application for viewing visual reports about your fleet performance. It allows to display and analyze graphics created in web-version of Dashboard for Wialon Hosting based on KPI’s (Key Performance Indicators) of the tracked vehicles. Main parameters, such as: mileage, fuel consumption, motohours, average and maximum speed, idling time, travel time, visiting of geofences — are presented in graphics. You can build them according to units (vehicles tracked) and unit groups. You can also choose the graphic type you like — linear, circular or bar charts are available.
To use the application you just need internet connection, preformed graphics and your iOS-device.
App information from Apple App Store. Dashboard for Wialon and related trademarks belong to Gurtam Inc..