
iPhone Screenshots

Description
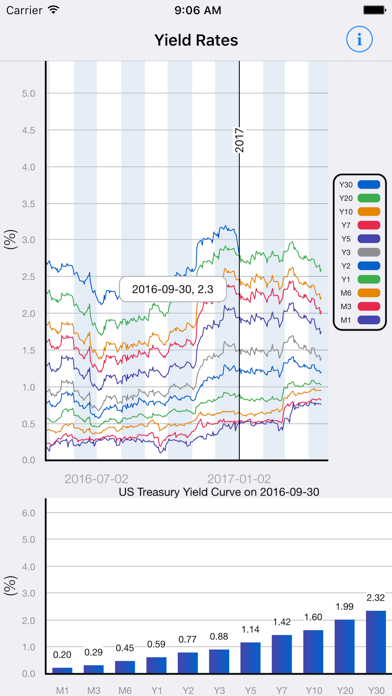
View U.S. Treasury Security yield trends for 2008-2023 and 2024+. Display line charts for historical and current data across maturities from one month to thirty years. Select dates to view detailed bar charts of yields. Access data via the FRED API.
This app helps visualize U.S. Treasury Security constant maturity market yield trends for current (2024+) and historical (2008-2023) time periods. The values shown are for various maturities from one month to thirty years. Scrollable line charts present all yields over time, while the bar charts display detailed yields for a selected date. While our app utilizes the Federal Reserve Economic Division (FRED) API, please note it is not endorsed or certified by any government or other organization. It is intended for educational use only.