
Art of Stat: Explore Data
Analyze and generate charts
Bernhard Klingenberg
iPhone Screenshots


iPad Screenshots


Description
Analyze categorical and quantitative with summary statistics, contingency tables, and correlation coefficients. Create bar charts, pie charts, histograms, boxplots, dotplots, and interactive scatterplots. Color scatterplot points by a third variable.
The Art of Stat: Explore Data app includes statistical methods for exploring categorical and quantitative data. Obtain summary statistics, contingency tables or correlation coefficients and easily generate bar- and pie charts, histograms, boxplots (including side-by-side boxplots), dotplots or interactive scatterplots that let you color dots by a third variable. Several example datasets are preloaded for you to explore (including instructions on the statistical analysis), but you can also enter your own data or import a CSV file.
The following methods are implemented:
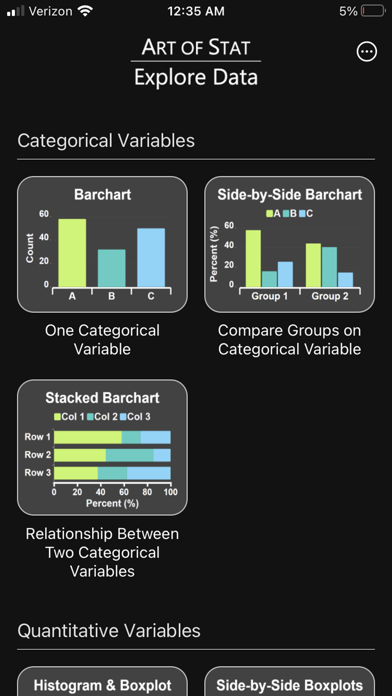
- Analyzing One Categorical Variable
- Comparing Groups on a Categorical Variable
- Analyzing the Relationship Between Two Categorical Variables
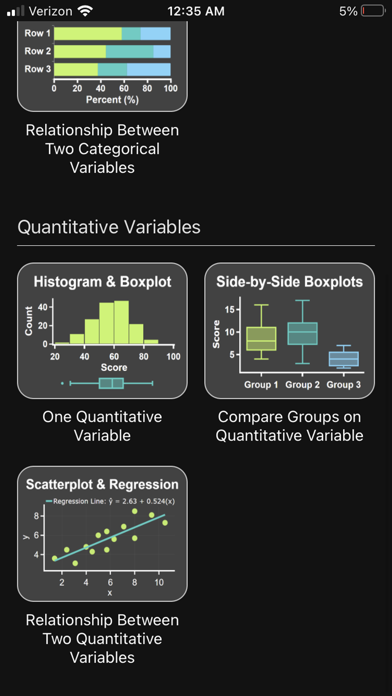
- Analyzing One Quantitative Variable
- Comparing Groups on a Quantitative Variable
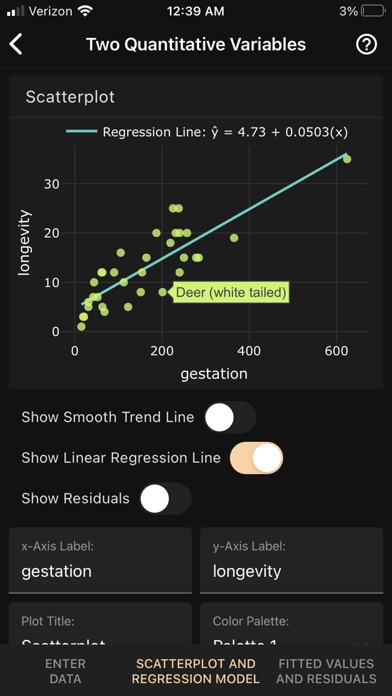
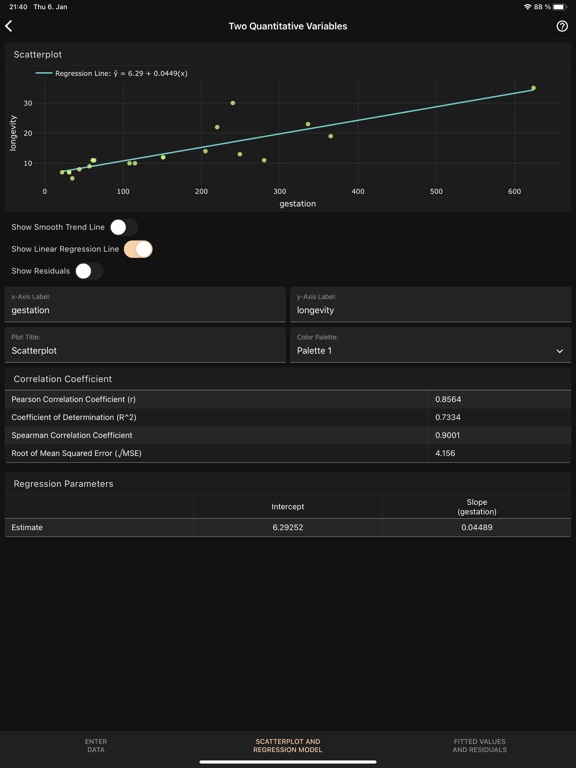
- Analyzing the Relationship Between Two Quantitative Variables (Linear Regression)
The app provides:
- Frequency tables and bar and pie charts for exploring one categorical variable.
- Contingency tables, conditional proportions and side-by-side or stacked bar charts for exploring a categorical variable across several groups or the association between two categorical variables.
- Mean, standard deviation and the 5-number summary together with histograms, boxplots and dotplots to explore a quantitative variable.
- Side-by-side boxplots, stacked histograms or density plots for comparing a quantitative variable across several groups.
- Interactive scatterplots with regression lines to analyze the relationship between two quantitative variables. Correlation statistics and linear regression parameters and predictions. Plots of raw and studentized residuals.
The app comes with several example datasets preloaded, which you can directly open in the app to explore the app's various features. You can also type in your own data or upload your own CSV file (which any spreadsheet program can create) and select variables from it. Finally the app includes a basic spreadsheet program called Data Editor to create and edit data.
You can also copy & paste data from a spreadsheet app such as Google Sheets, Excel or Apple’s Numbers app. Several sample datasets are provided.
App information from Apple App Store. Art of Stat: Explore Data and related trademarks belong to Bernhard Klingenberg.