
Art of Stat: Distributions
Explore with interactive visuals
Bernhard Klingenberg
iPhone Screenshots


iPad Screenshots


Description
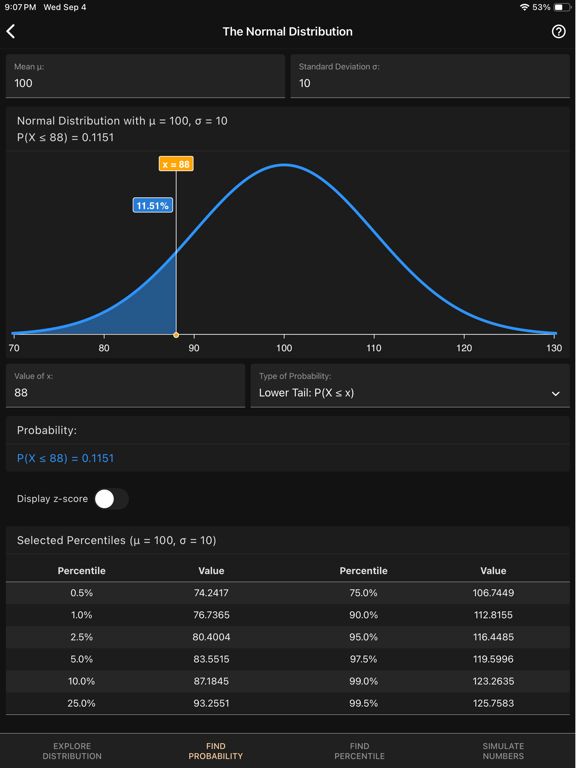
Explore probability with interactive sliders and buttons. Calculate probabilities and percentiles for upper tail, lower tail, or two-tailed tests. Visualize results alongside numerical solutions. Compare continuous and discrete side-by-side.
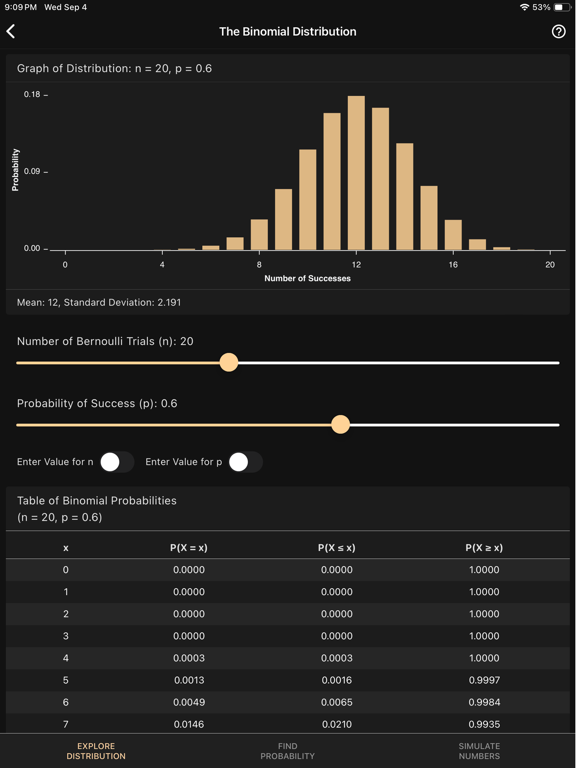
The Art of Stat: Distributions app explores and visualizes continuous and discrete probability distributions via sliders and buttons.
Don't rely on boring and complicated graphing calculators that don't deserve their name. Instead, use the interactive graphics that this app provides to learn about probability distributions and visualize results side-by-side with the numerical solutions.
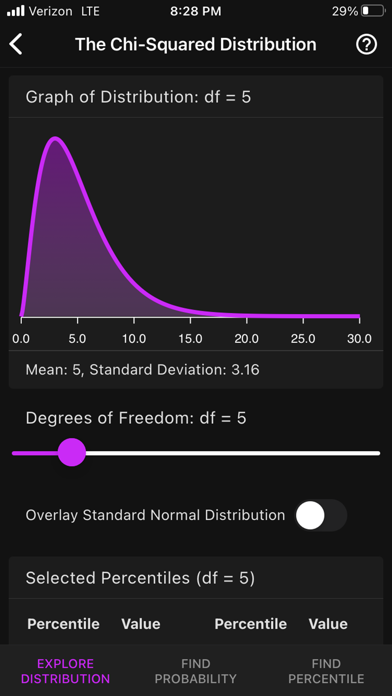
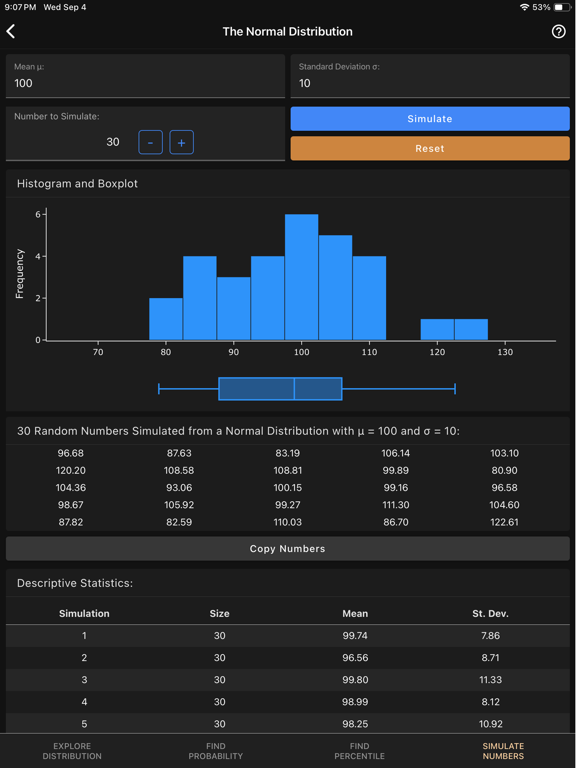
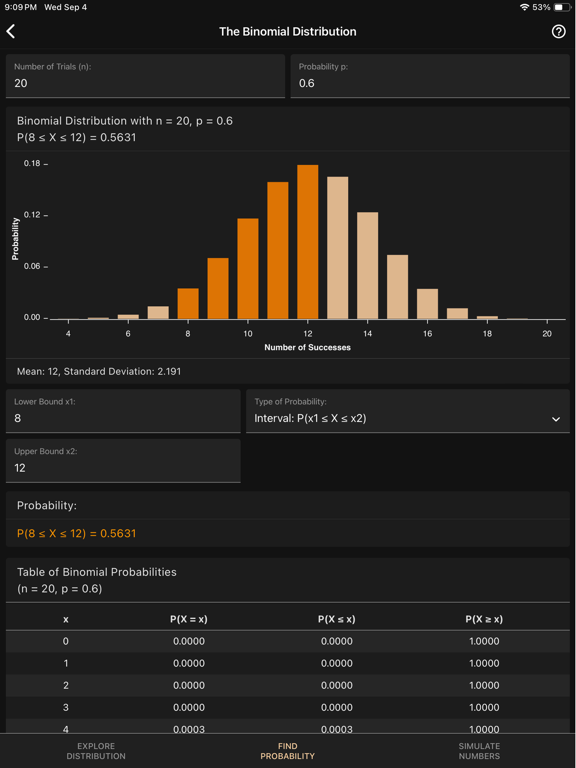
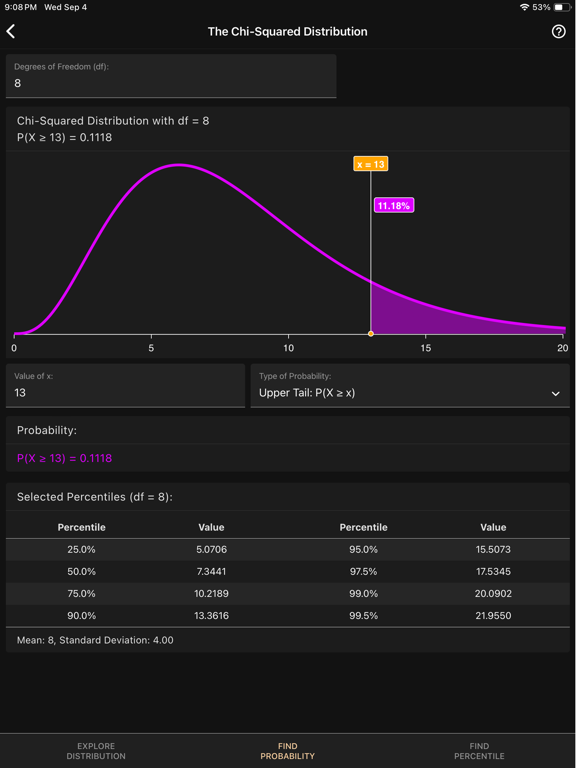
Find probabilities or percentiles (two-tailed, upper tail or lower tail) for computing P-values or when working with discrete distributions. Obtain critical values for confidence intervals. Display the expected value and standard deviation, and simulate random numbers.
The app works in offline (airplane) mode and indicates this by changing the background color.
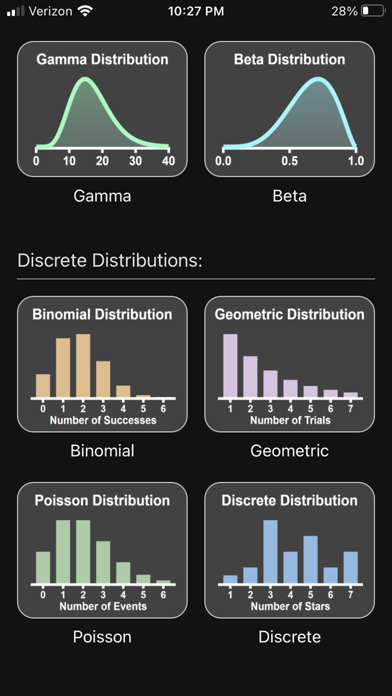
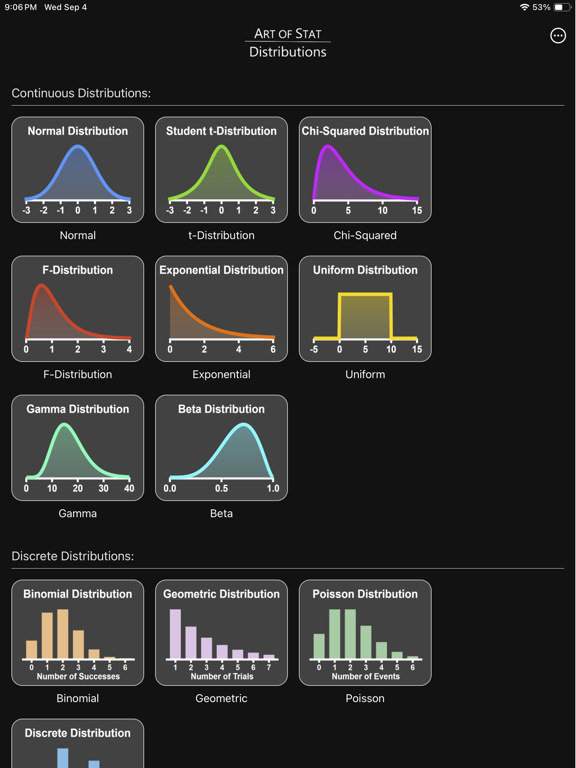
Continuous Distributions implemented so far:
- Normal
- Student's t
- Chi-Squared
- F
- Exponential
- Uniform
- Gamma
- Beta
Discrete Distributions:
- Binomial
- Geometric
- Poisson
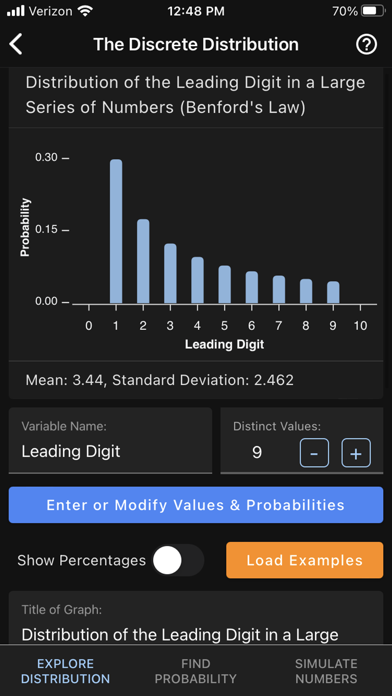
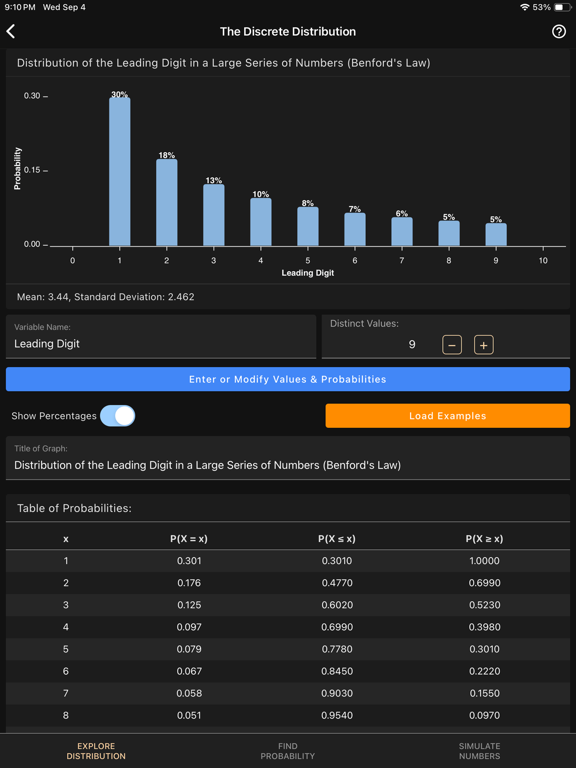
- Define Your Own Discrete Distribution, or choose from preloaded examples, such as Benford's Distribution of the leading digit
App information from Apple App Store. Art of Stat: Distributions and related trademarks belong to Bernhard Klingenberg.