Trellis Dashboard
View sensor data and track crop conditions
TRELLIS, INC.
iPhone Screenshots


Description
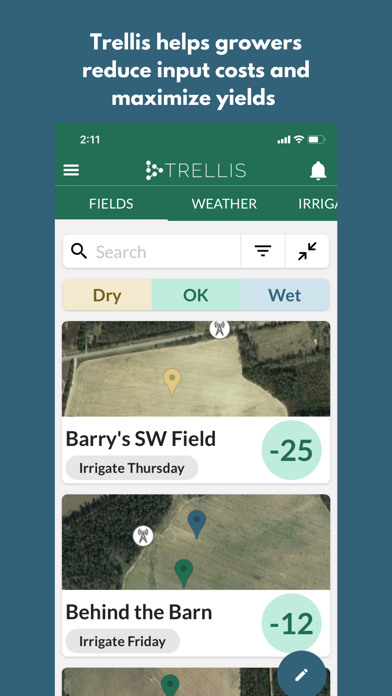
View live sensor data including soil moisture, temperature, and electroconductivity. Edit or delete weather data from connected devices. Log irrigation and precipitation events. Customize sensor management plans.
Trellis' easy-to-use farm intelligence platform helps growers maximize yields & reduce input costs. The Trellis Dashboard application allows you to view your data on-the-go.
This app allows you to:
- View graphs of live sensor data (soil moisture, temperature, electroconductivity, pressure sensors)
- View, edit, & delete weather data from connected rain gauge, weather station, or NOAA data
- Log irrigation & precipitation events
- Sensor Management Plans let you customize the way the sensor station data is interpreted throughout the growing season. As your crop develops, you can account for changing root depths & different crop growth stages that may require more or less water.
- Group sensors into fields and weight the sensors in each field
- Edit sensor information
- Change how you're notified that a sensor is dry (text/email notifications)
- View your sensors & their soil moisture status (wet/ok/dry) on a map
- Browse our knowledge base of helpful support articles & chat with Trellis employees to answer questions