
iPhone Screenshots



Description
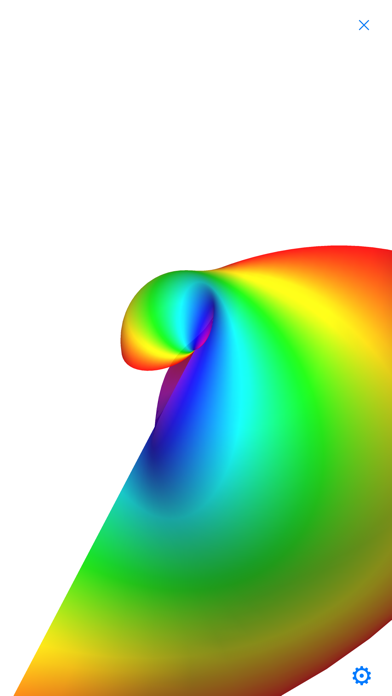
Graphs 2D and 3D functions including parametric and polar coordinates. Supports implicit graphing and complex map visualizations with domain coloring.
A graphing + scientific calculator.
-2D and 3D graphing
Graphs regular functions, parametric relations, and functions in polar/spherical coordinates.
-Implicit graphing
-Visualization of complex maps w=f(z) featuring domain coloring plots
-For 2D functions: Info mode with tangent line and 2nd-order Taylor approximation
Scientific calculator features:
-User-defined variables and functions
-Symbolic derivative (e.g.: D(x, sin(x))
-nCr, nPr, factorial
-Complex numbers
-Live evaluation (calculate as you type)
-Calculation history
-Probability density functions: Binomial, Normal (Gaussian)
Examples:
Implicit graph: cos(X)=sin(Y)
Graph a parabola in Regular mode: X^2
Graph a circle in Parametric mode: cos(T);sin(T)
Set a variable: X=5
Use a variable: X+4: 9
Define a function: f(X)=X+1
Use a defined function: f(2): 3
Symbolic derivative: D(X,sin(X)): cos(X)
Complex magnitude plot in 3D Regular mode: abs(1/cos(X+Yi))
Notes:
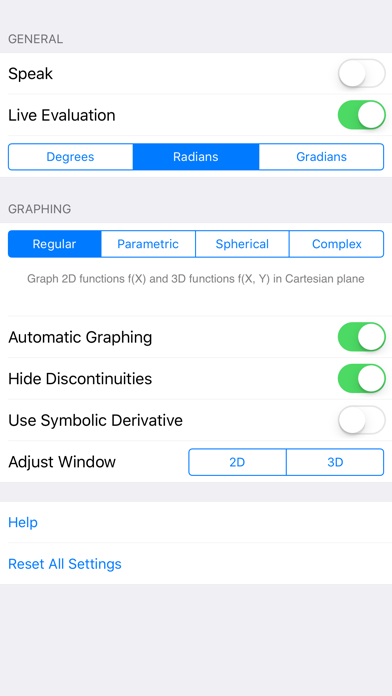
-Swipe left for settings.
-Use semicolon (;) to separate functions in parametric relations.
-Swipe down on keypad to show full history. Tap on answer to show keypad again.