Sound levels with SPL metrics including current average, peak, average maximum, and absolute maximum. Display graph histograms for adjustable settings. Save measurements and reset max values by tapping. Support upside down orientation for easy use.
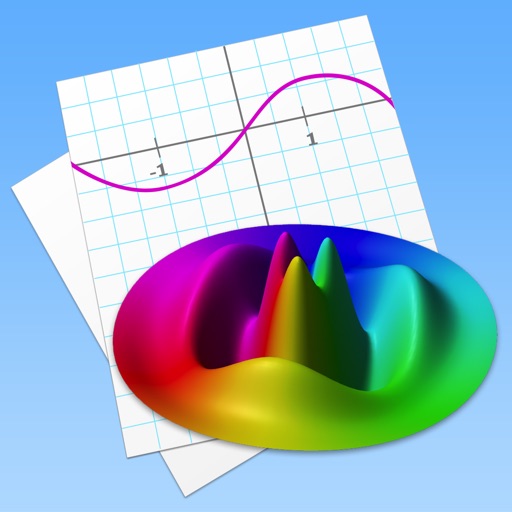
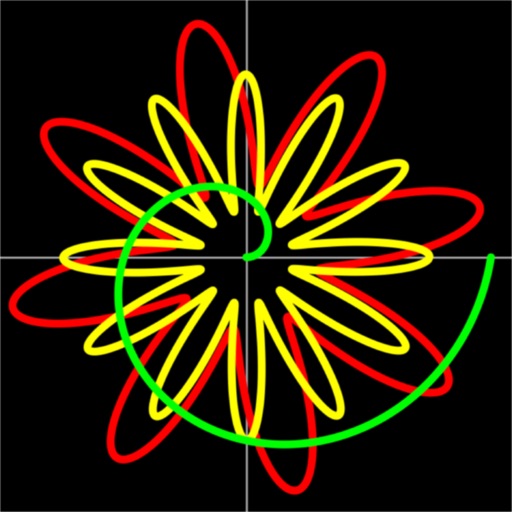
Allows users to plot functions, implicit relations, and parametric curves. It supports 3D graph visualization in AR. Features include inequality plotting, vector fields, and coordinate transformations.
Allows users to read and clear engine diagnostic trouble codes, view existing vehicle licenses, analyze past datalogs, and access the user guide. It serves as a transition tool to the unified "MHD " .
View and pay bills with real-time updates. Access historical usage data in graphical form. Manage payment schedules and notifications. Review past payments and account details. Set up automatic payment reminders.
View and pay bills with transaction history. Access historical usage data in graph format. Manage payment settings and notifications. Track past payments and account details. Receive payment confirmations and alerts.
View and pay bills with real-time updates. Access past payments and historical usage data in graphical format. Manage payment schedules and customize notification preferences. Track account activity and review transaction details.
View and pay bills directly. Check past payments and historical usage with graphs. Manage payment schedules and notifications. Set up automatic payments and receive alerts.
View and pay bills with real-time updates. Access historical usage data in graphical format. Manage payment schedules and notification preferences. Track past payments and account activity.
View daily schedules in a 24- pie graph. Select from 24 color patterns. Receive notifications for events. Save multiple schedules and switch between weekly days. Export schedule parts as images.
Solve math problems with natural textbook input and fraction support. Trace graphs with touch. Zoom using pinch gestures. Tap for regression analysis. Swipe to scroll through calculation history and matrices. Access help via the ? key.
Measure sound levels with a decibel meter that displays current, maximum, and average values. View values on a gauge and in a graph. Set and track sound level measurements. Share results directly. No in- purchases required.
View and pay bills directly. Access past payments and historical usage data in graph form. Manage payment schedules and notifications. Set up automatic payments and receive alerts for due dates.
View and pay bills directly. Access past payments and historical usage data in graphical format. Manage payment schedules and notifications. Set up payment reminders and account alerts.
View and pay bills, check past payments, and access historical usage data in graph form. Manage payments, set notifications, and track account activity.
View and pay bills with real-time updates. Access historical usage data in graphical format. Manage payment schedules and notifications. Track past payments and account activity. Set up payment reminders and account alerts.