Create line charts, bar charts, and pie charts. Input data manually or copy-paste from spreadsheets. Customize colors, labels, and axes. Export visuals as images or PDFs. Share charts via email or messaging apps.
Create and customize charts using data from Apple . Add series, style axes and shapes, export charts as images, and copy them to the clipboard. Retrieve chart information and manage multiple charts.
Calculate compound annual growth rate by inputting starting value, ending value, and investment period. Perform calculations using the provided formula. Export results for record-keeping.
Add, subtract, multiply, and divide numbers up to five decimal places. Maintain a running total and view a scrollable . Copy or paste numbers by touching and holding the display area.
Create and manage lists with auto-suggestions for products. Add, edit, and delete items. Set reminders and organize items into categories. Sync across devices and share lists with others.
Calculate potential earnings by entering parcel types, adjusting boosted hours, and setting badge boost percentages. Estimate rent income based on parcel ownership. View how many can be purchased before the next boost drop.
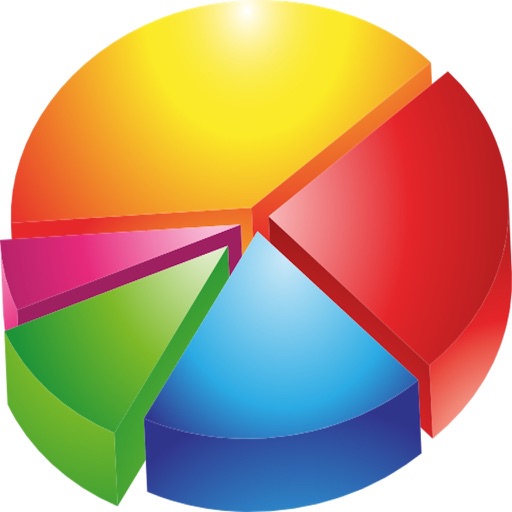
Track and habits using a colorful pie to visualize daily activities. Schedule events and view records on a calendar. Edit and review daily logs with detailed entries and historical data. Sync schedules across days for consistent tracking.
Calculate payments and generate amortization schedules
Calculate payments with adjustable parameters like principal, interest rate, and term. mortization schedules and view interactive charts and tables to track financial progress. Set reminders for payments and export data in multiple formats.
Resistance values by entering SMD codes or color combinations. Convert values instantly. Display results in ohms, kilohms, and megohms. Automatically calculate tolerance and percentage deviation. Export data as text or share via email.
Convert volumetric units to weight-based units for 15 industrial gases. Select gas type, input volume, and choose unit type. View enthalpy, boiling point, and temperature values for 0°C, 15°C, and 20°C.
Manage personal finances and DeFi investments with a . Adjust time periods and set tax rates for precise calculations. View pie and line charts to analyze investment breakdowns and compare simple versus over time.
Identify resistor values by entering code or value. Support for through-hole and SMD . Provide resistor color codes and numerical values. Available in English, French, German, and Spanish.