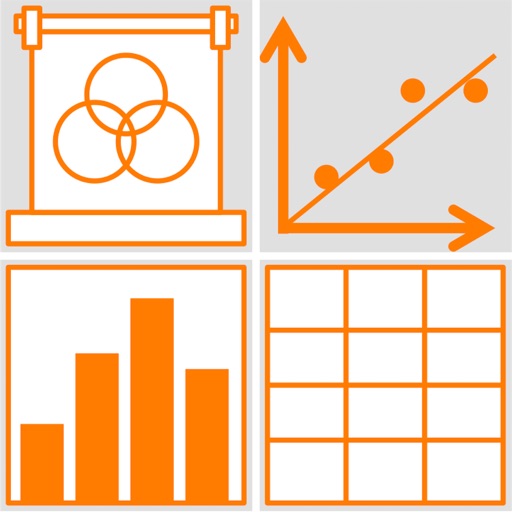
Analyze datasets by importing files or entering manually. Apply filters to focus on specific rows. View key statistics and visualizations for each variable. Understand results with plain English explanations of statistical methods.
Track financial markets including , , indices, stocks, and synthetics across multiple platforms. Set custom price targets and indicator such as RSI, MACD, and MA. Receive real-time notifications and email for price changes and trading signals.
Track spending habits and set savings goals based on daily reflections. Use behavioral insights to adjust spending patterns. Receive prompts to review expenses and reflect on financial decisions. Sync data across devices for consistent tracking.