The app allows users to enter and modify formulas while checking them, preventing errors. It provides a history of formulas and answers, supporting various number systems and memory functions for calculations.
Calculate future CD value by inputting deposit amount, interest rate, and term. Compare growth scenarios and adjust rates to see impact. View results instantly with a simple interface.
The app offers scientific and standard modes with over 30 scientific operations. It supports degrees and radians, parentheses, and output in decimal or scientific notation.
Solve mathematical problems with fraction, decimal, and equation input. Display results in decimal, rational, , or trigonometric formats. Support up to 16 decimal places for precise calculations.
Manage and control Pi devices from an iPhone or iPad. Monitor system status, locate devices on the network, and perform actions without using SSH. Set up new devices, manage multiple systems, and access system logs and settings.
Record network traffic including TCP, UDP, DNS, and HTTP. Apply rules based on domain, keywords, IP ranges, and URL patterns. Modify traffic with policy groups and intercept requests for analysis.
Convert values between units in 22 categories including acceleration, angle, area, and data storage. Support currency exchange for 160 currencies. Search units by category or globally. Bookmark frequently used conversions.
Enables users to block ads and trackers, encrypt connections, and protect data. It prevents unwanted scripts and enhances online security. Users can browse the web with enhanced privacy features and secure data protection.
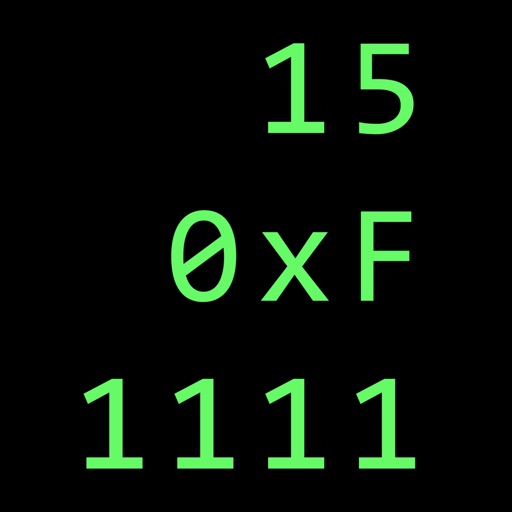
Calculate in binary, hex, and decimal simultaneously
Convert numbers between binary, hexadecimal, and decimal bases. Display all three bases simultaneously. Switch input modes and see results in all bases. Perform arithmetic, logic, and bitwise operations. Support unsigned and 2’s complement numbers.
Calculator++ allows users to input data via "Add X," "Add Y," and "Add Z" buttons. It calculates sum, mean, standard deviation, quartiles, and more. Results are displayed in a table. Box and whisker plots and histograms visualize data.