Calculate stats, graph data, and explore distributions
Calculate descriptive statistics, generate graphs, and explore common distributions. Perform one and two sample hypothesis tests. Compute probabilities and inverse probabilities with visual representations.
Explore atomic structure and behavior through interactive simulations. Manipulate and observe molecular dynamics in real time. Perform computational chemistry calculations and analyze motion patterns.
View images and slide through high-definition photos
View rover images from Perseverance, Curiosity, Opportunity, and Spirit. Tap to enter slideshow mode, double-tap to zoom, or share images. The tab displays visuals about atmosphere, gravity, temperature, and surface features.
Analyze stock prices and cryptocurrency values with probability risk assessments. Compute portfolio optimizations using historical returns. Perform pairwise correlation and regression analysis on daily returns.
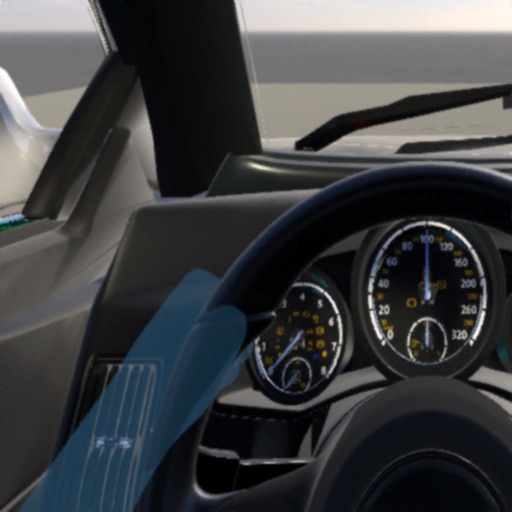
Visualize thermal in vehicle cabins using HVAC flow simulation. Adjust heating and ventilation settings. Hear and see airflow distribution. Predict climate system performance in real-world conditions. Share simulation results with team members.
Visualize reactions in 3D with quantum simulations
View 3D models of chemical reactions based on quantum-mechanical simulations. Rotate, zoom, and dissect molecular structures. Annotate diagrams and save notes for later review. Share visualizations with classmates or instructors.
The app provides a basic remotely controlled patient monitor for medical simulation. Users can change vital signs like blood pressure and heart rate by touching and dragging values on the screen.
Analyze test to identify potential health risks and diseases. Provide personalized insights based on individual health data. Simulate disease scenarios using advanced algorithms. Track health trends over time. Share with healthcare professionals.