
iCelsius
Aginova Sarl
Sense the world with temperature data.
The app reads temperature data and generates graphs. Users can set up alarms for temperature limits and record readings with notes and pictures.

Showing 121–140 of 1,000 ranked alternatives.
Aginova Sarl
Sense the world with temperature data.
The app reads temperature data and generates graphs. Users can set up alarms for temperature limits and record readings with notes and pictures.
Nixus Development
A convenient scientific calculator app.
The app provides standard scientific functions like roots, powers, and logarithms. It also includes features such as graph drawing, multiple memory blocks, constants, notes, and a history log.


Shahbaz Khan
And build web apps
With interactive tutorials and project-based lessons. Complete exercises to practice coding concepts. Access code examples and debug tools. Track progress and review lessons for reinforcement.

Prachi Pimpalkhare
Track scores and reset quizzes
Track knowledge with a scoreboard that records scores. Reset individual topic quizzes to restart learning. View progress through a pie graph showing topic mastery.

Pomegranate Apps LLC
Compute, plot, animate math equations
Create and test mathematical algorithms with a powerful computational engine. Build interactive plots and animations. Execute code and view results in real-time. Share calculations and export data in multiple formats.

Voxeloid Kft.
Solve math problems instantly
Solve math problems from basic arithmetic to advanced algebra. Perform exact fraction calculations and store unlimited variables. Create custom functions and graph equations. Use a powerful algebra engine for precise results.


JC Accounting & Innovative Technologies, Inc
Calculate with custom tour times
Calculate based on set tour lengths and actual worked times. Input normal tour duration once, then enter worked tour for calculation. Supports RDO, PreTour, and wrap-around . Set rates and compute compensation in cash or time.


Evan Kantrowitz
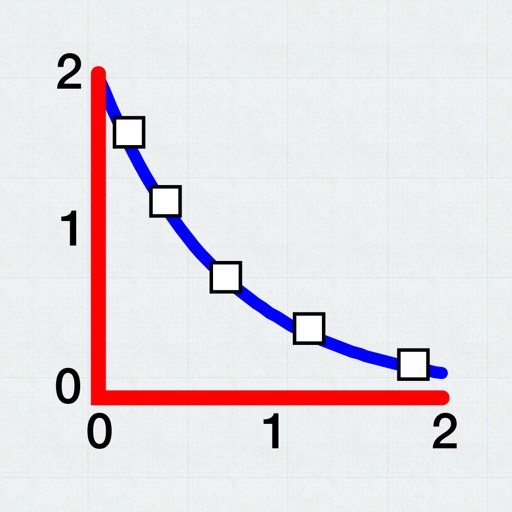
Plot data, fit curves, predict values
Allows users to plot and fit x, y data pairs. It supports curve fitting, value prediction, and kinetic data analysis. Data can be entered manually or imported from text or CSV files. Users can perform statistical analysis and generate graphs.


Apps are ranked by functional similarity, category fit, rating confidence, and popularity.