Monitor real-time tip temperature and power values. View live temperature and power charts. Adjust temperature set point. Track voltage, handle temperature, uptime, and power source data.
by Lachlan Bell★ 5.011 ratingsUtilitiesFreeData updated 2026-09-06
Allows users to visualize data. Customize which information to display and organize views. Create personalized dashboards for tracking sales, weather, or room temperature.
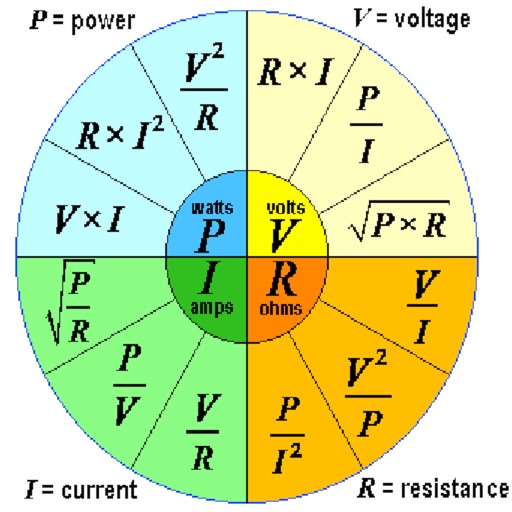
Calculate voltage, current, resistance, or electric power by entering any two values. Convert results between normal and scientific notation. Display calculated values clearly.
Measures atmospheric pressure, altitude, and temperature using device sensors. Displays real-time readings and historical data. Alerts for pressure changes. Syncs with weather services for forecast updates.
The app controls Ltech WIFI-103 series LED controllers via WiFi. It supports RGB, color temperature, and single color modes, with scene saving and custom dynamic style creation.
BALLISTIC SOLUTIONS RESEARCH & DEVELOPMENT SOFTWARE SIARHEI RAICHONAK
Jet tune engines with real-time data
Provides recommendations for specific engines based on weather data and engine configuration. It retrieves temperature, pressure, and humidity from weather stations or an internal barometer.
Convert units for length, weight, temperature, volume, and more. Input values and select units for instant conversion. Access a clear interface with accurate results and quick access to common conversions.
View real-time updates for with radar images and expert video forecasts. Check morning, afternoon, and evening forecasts. See rainfall probabilities, perceived temperature, and temperature ranges.
Displays device hardware and software details, including version numbers, serial number, PIN, system voltage, and temperature. It allows editing Bluetooth name and PIN, adjusting settings like idle time, screen brightness, IR power, and USB mode.
Monitor underwater fish activity with real-time sonar data. Track fish location, size, and depth up to 40 meters. Display water temperature, depth, and topographic maps. Share sonar data via mobile device.
View energy usage data from dashboards. Monitor electricity, temperature, and environmental metrics. Visualize logs and trends. Connect to servers for real-time updates and historical analysis.
Track vehicles with real-time GPS updates. Optimize routes to minimize fuel costs. Monitor fuel consumption and temperature data. Set alerts for vehicle status and maintenance needs. Manage fleet operations remotely with automation tools.
Convert across distance, area, volume, weight, speed, temperature, power, energy, and fuel consumption. Switch between metric, imperial, and other regional systems. Convert height in centimeters to feet and inches.
Display current weather with temperature, wind speed, humidity, and real-time icon. Show date and city name. Customize font and theme. Add to home screen without additional steps.
Calculate size based on current, voltage, and temperature. Input circuit parameters to determine AWG rating. Provides resistance and voltage drop calculations. Supports FAA-approved voltages: 14VDC, 28VDC, 115VAC, 200VAC.
The app provides a procedure to adjust tire pressure when the tire temperature is not in a cold state. It addresses changing weather conditions and real-world driving scenarios.