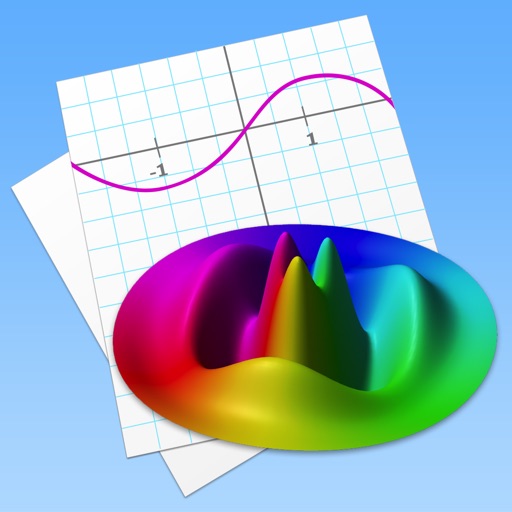
Allows users to plot functions, implicit relations, and parametric curves. It supports 3D graph visualization in AR. Features include inequality plotting, vector fields, and coordinate transformations.
Create and manage inspection checklists with customizable templates. Add scores for each item, take and annotate photos. Assign actions and track progress without requiring accounts or sign-ups.
Track weight lifting workouts by logging sets, reps, and weight lifted. Calculate and view 1RM. Create custom plans or select from existing programs. Monitor progress with detailed tracking and statistics.
Monitor real-time energy usage with detailed data graphs and system performance insights. Track home energy flow and set usage alerts. Manage system settings, perform self-inspections, and access commissioning tools for installers.
Track study hours, performance, and top subjects using detailed graphs. Access a personalized AI tutor for subject-specific help. Organize study sessions, set goals, and monitor progress with customizable plans.
The app builds interactive graphs of the Gompertz function and its derivatives. It fits curves to data, solves Gompertz function equations graphically, and calculates saturation and inflection points.
Track expenses and income with categorized entries. Set budgets for specific categories. Receive notifications for spending limits. View monthly summaries and adjust budgets as needed. Sync data across devices.
View data through six customizable dashboards with detailed report access. Access over 100 standard reports for Universal and GA4. Interact with graphs and export data for further analysis.