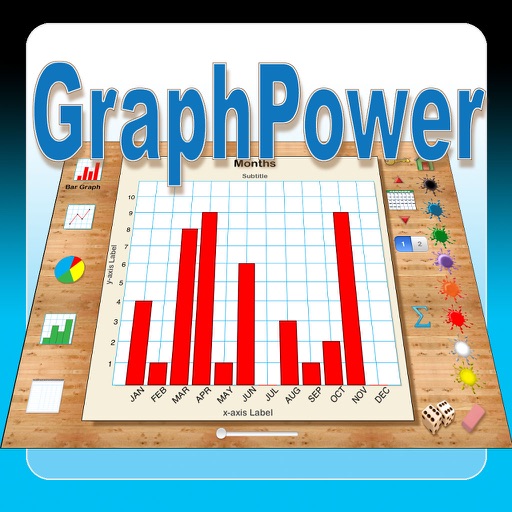
The app offers an educational tool for data analysis and graph interpretation. Students can create bar graphs, line graphs, circle graphs, and histograms on their iPads, with options for titles, labels, and scales.
by Ventura Educational Systems★ 1.01 ratingsEducation$2.99Data updated 2026-10-04
The app helps users focus on tasks by working in timed intervals with short and long breaks. It tracks completed sessions and allows users to view time spent on activities via a graph.
Connects to pressure and force sensors via USB, Bluetooth, and Wi-Fi. Displays real-time data visualization. Analyzes sensor data for detailed insights. Saves and exports measurements in multiple formats. Tracks sensor performance over time.