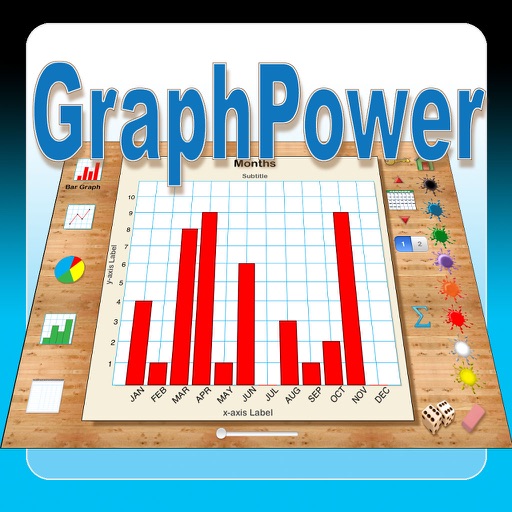
The app offers an educational tool for data analysis and graph interpretation. Students can create bar graphs, line graphs, circle graphs, and histograms on their iPads, with options for titles, labels, and scales.
by Ventura Educational Systems★ 1.01 ratingsEducation$2.99Data updated 2026-10-04
This app provides 56 illustrated flash cards to help students discuss reactions to community situations. Users can select cards, track responses, and view results in a graph.
The app offers input for arithmetic, trigonometric, and Greek characters with superscript and subscript options. It supports Air Print, PDF creation, graph generation, and drawing various mathematical symbols and shapes.
The app wirelessly collects data from up to 15 built-in science sensors for iPad. It allows for setup and data analysis of hands-on experiments in various science subjects, engaging students with interactive features.