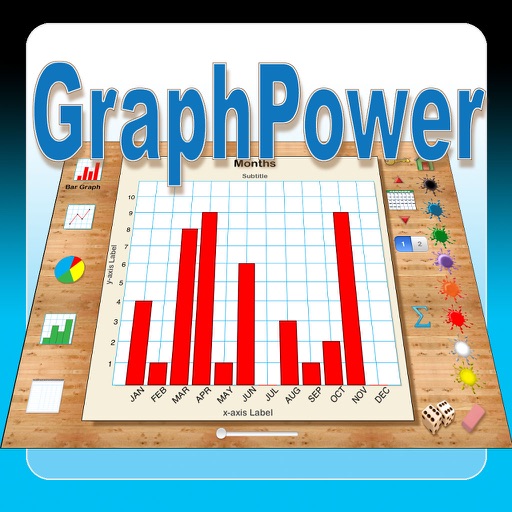
The app offers an educational tool for data analysis and graph interpretation. Students can create bar graphs, line graphs, circle graphs, and histograms on their iPads, with options for titles, labels, and scales.
by Ventura Educational Systems★ 1.01 ratingsEducation$2.99Data updated 2026-10-04
Track daily habits and routines with customizable reminders. View progress through graphs and charts. Set and monitor repeated tasks to build consistent behavior over time.
Monitor and control ® and ® Secure Courier environments. View detailed information on sites, processes, threads, servers, groups, and couriers. Start and stop components as needed. Access graphs showing thread and courier statistic trends.
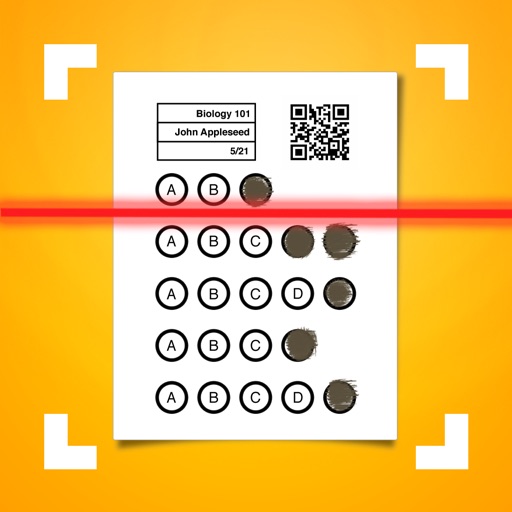
Allows users to create classes and configure assessment answers. It automatically grades bubble sheets and displays scores in real time. Export data to XLS or CSV, sync with Google Classroom, and integrate with .
Practice mental math with customizable problem types including addition, subtraction, multiplication, fractions, and division. Set numerical ranges, session duration, and difficulty levels. Track progress and review results.
The app allows users to track and log everyday subjects like journals, diaries, economy, workouts, and more. Users can create custom lists with various input elements and view numerical data over time using graphs.
The app provides information on option strategies and models. Users can create interactive graphs to visualize risk and value under different market conditions and test their own strategies.