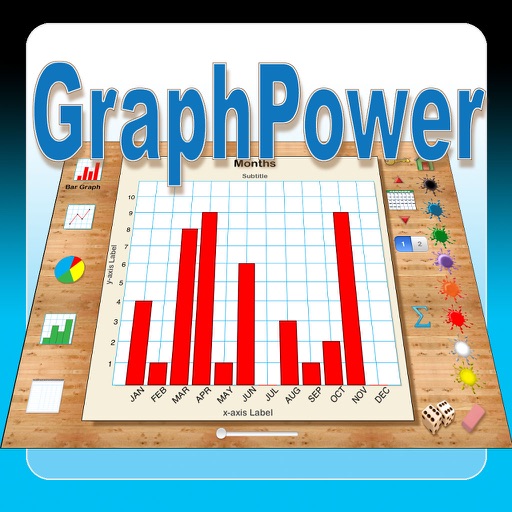
The app offers an educational tool for data analysis and graph interpretation. Students can create bar graphs, line graphs, circle graphs, and histograms on their iPads, with options for titles, labels, and scales.
by Ventura Educational Systems★ 1.01 ratingsEducation$2.99Data updated 2026-10-04
Visualize files as interactive graphs. Zoom in and out for detailed views. Edit content directly. View selected items in an editable table. Change data types with a pull-down menu. Undo or redo changes. Copy and paste segments.
The app logs and graphs internet connection speeds and outages. It monitors servers and IP devices, schedules pings and HTTP requests, and graphs network traffic stats.
Standard performs basic operations like addition, subtraction, multiplication, and division. includes trigonometric functions, power calculations, and constants. Access calculation history. Calculate area for circles and triangles.
Track solves with a customizable timer that functions like an official competition timer. Create and customize sessions to log timed attempts. View statistics and graphs of performance. Export and import session data for sharing or backup.
Explore concepts through interactive topics covering limits, derivatives, and integrals. Graph functions, compute derivatives numerically, and visualize solutions. Test hypotheses and verify computations with graphical representations.
Track academic performance by entering grades and assignments for multiple courses. Calculate overall course grades in real-time. Set custom grading scales. View grades with visual graphs and progress overviews.