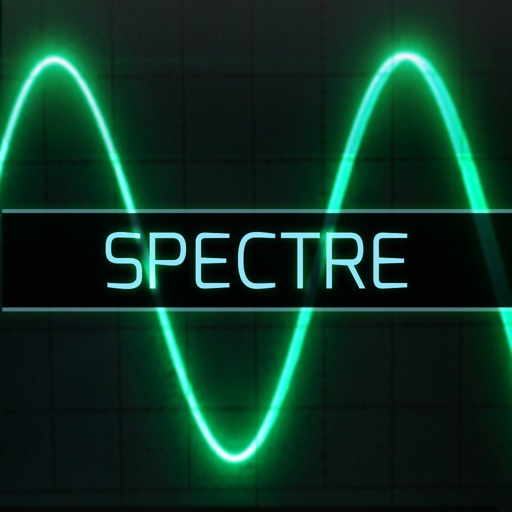
Displays waveforms with a grid and tick marks on the horizontal axis. Users can set time divisions per horizontal unit. The vertical axis has a solid and dashed line for reference. Users can adjust display settings and analyze waveform data.
by Hidetomo Katsura★ 0.00 ratingsUtilities$4.99Data updated 2026-09-08
Calculate coordinates and grid squares for projects
Offers calculators for designing radios and antennas. Users can find latitude and longitude from a maidenhead square or vice versa. Calculate distances between squares. Convert units. Locate current position.
Configure waveform, intensity, frequency, speed, timing, and cycle settings. Adjust two independent channels. Monitor physiological data for adaptive pulse stimulation. Lock stimulation at the G edge for consistent performance.
Udio test tones with adjustable frequency and amplitude. Create sine waves from 20 Hz to 20 kHz. Add white noise, pink noise, and frequency sweeps via in- purchases. Support square, sawtooth, and triangle waves on compatible devices.
Measure horizontal and vertical angles with precision. Set reference points and receive haptic feedback for alignment. Mark reference points and adjust settings for accurate measurements.
Allows users to perform advanced signal analysis with an oscilloscope and spectrum analyzer. It enables waveform generation, data logging, and frequency response testing. Users can control PID systems, build filters, and analyze laser stability.
Learn and practice and modes with interactive lessons and scale position loops. Swipe across strings to play and adjust speed. Use the tuner to stay in tune. Track progress and build muscle memory for improved finger dexterity and improvisation.
Measure sound levels in decibels using device microphone. Display average, max, and min decibel values. Show real-time peak and average graphics. Calibrate for accurate readings. Choose measurement frequency. Record audio and save files.
Udio signals for up to 16 channels. Choose from four wave types: sine, triangle, square, and saw. Adjust volume per channel. View and summarize waveform settings at the bottom of the screen.
Measure objects using screen size, augmented reality, or printed rulers. Place virtual on surfaces with ARKit. Print rulers via AirPrint. Compare printed results with on-screen measurements. No ads, in- purchases, or tracking.
Learn and with interactive exercises. Practice scale loops to build muscle memory and finger dexterity. Swipe across strings to play notes and adjust speed. Use a metronome to improve rhythm. Includes tuner for staying in tune.
Realtime analyzer processes live input with Fast Fourier Transform and window functions. Record for offline analysis. Visualizer module displays frequency data from recorded files. Export analysis results and files.