Apps Like Vernier Graphical Analysis GW for iPhone and iPad
Collect, graph, and analyze sensor data.
The app supports data collection from various Vernier sensors and offers multiple data analysis features. Users can graph and analyze sensor data, perform calculations, and export results for reports.
by Vernier Software & Technology★ 2.4158 ratingsEducationFreeData updated 2026-09-29
The app provides automated object tracking and video analysis. Users can capture video, track objects, and instantly generate trajectory, position, and velocity graphs.
Monitor sensor data in real time including accelerometer, gyroscope, GPS, barometer, and compass. View detailed readings and generate graphs. Use decibel meter, metal detector, and other tools for environmental measurements.
Detects electromagnetic fields with accurate readings. Tracks anomalies using radar. Records audio for EVP sessions with five voice options. Includes a sensitive microphone and vibration sensor. Alerts for sensor activity.
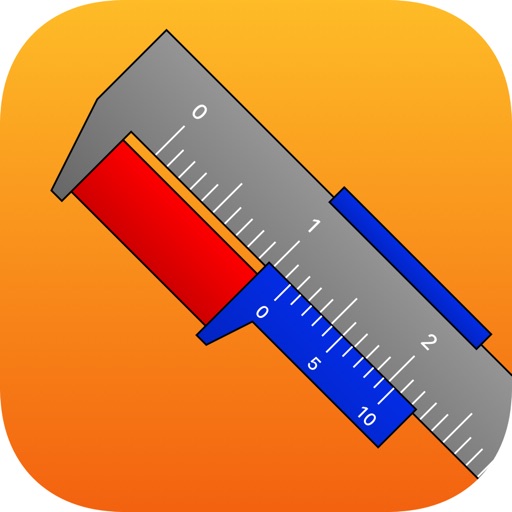
The app allows users to practice reading a vernier caliper on their iPhone. Users can slide their finger to grip an object and enter their reading to check if it is correct.
VSI sprayer operations using auto rate with sensor and GPS data. Track usage and export data in CSV format. Monitor settings and adjust parameters remotely.
Monitor and control wireless sensor tags for temperature, humidity, motion, and water detection. Receive push notifications for door/window status, water presence, or environmental thresholds.
Track GPS and GLONASS satellite data including position, accuracy, speed, altitude, and orientation. Save and navigate to locations using coordinates or real-time data. Use a compass with magnetic and true north, a leveling tool, and waypoints.
Calculator++ allows users to input data via "Add X," "Add Y," and "Add Z" buttons. It calculates sum, mean, standard deviation, quartiles, and more. Results are displayed in a table. Box and whisker plots and histograms visualize data.
Monitor device with real-time data display and graphical charts. View text output and detailed descriptions for each sensor. Perform sensor tests and check parameters. Export data for analysis.
Use phone sensors to measure magnetic fields, gravitational acceleration, and sound. Run preloaded experiments or create custom ones. Export raw data and results for analysis. Share experiments with others.
Monitor vehicle health with real-time diagnostics. Inspect ignition, exhaust, and electronic systems for faults. View fault codes with three severity levels. Clear stored fault codes from the ECU. Analyze driving patterns to improve efficiency.
Create 3D scans using photogrammetry and lidar. Adjust scale with April Tags for real-world measurements. Export data in e57 format for analysis. Process data locally or in the cloud without internet transmission.