The app plots Bode and Nyquist diagrams for transfer functions. It visualizes impulse response and analyzes system stability, showing pole counts and encirclements.
by Fabrizio Boco★ 0.00 ratingsProductivity$5.99Data updated 2026-09-20
Write notes, create checklists, and schedule tasks. Adjust text size with pinch gestures. Automatically expand column height based on text or font size. table of contents for organized notes.
Learn about structure stages with detailed diagrams and explanations. Explore example proteins showcasing structural aspects. View unique properties and functional roles of each .
Helps users communicate by selecting the first few letters of words they think of. It allows users to write messages with their finger or draw pictures to convey meaning. The provides context by suggesting topics and words based on initial letters.
Record and visualize physical phenomena using smartphone or tablet sensors. Measure sound, motion, light, and temperature. Connect external sensors like micro:bit and Arduino for advanced experiments.
Manage employee training with online courses, assessments, and progress tracking. Create and distribute knowledge resources. Integrate with enterprise systems for learning and capacity development. Monitor training outcomes and business impact.
-Map enables real-time mapping using , RGB-D, or stereo cameras. It performs simultaneous localization and mapping with graph-based SLAM. The loop closure detector identifies previously visited locations using a bag-of-words method.
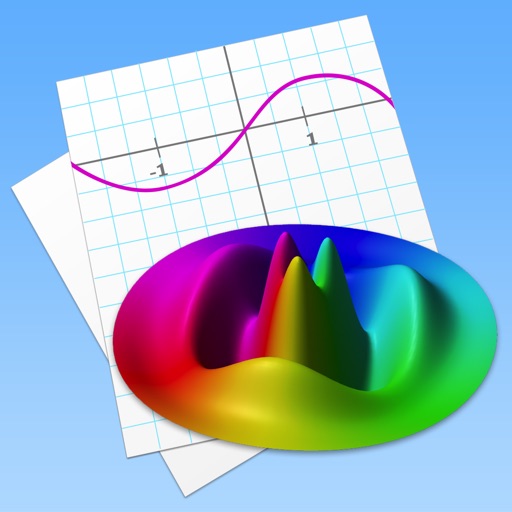
Allows users to plot functions, implicit relations, and parametric curves. It supports 3D graph visualization in AR. Features include inequality plotting, vector fields, and coordinate transformations.
Generate charts by typing AI prompts or selecting types. Create scatter plots, bar graphs, and other visualizations. Import data files to customize charts. Export images in various formats and share directly.
The app plots graphs of functions based on user-entered formulas and ranges. Users can input multiple functions separated by semicolons and view them simultaneously.
Calculate missing sides of right-angled triangles using the Pythagorean theorem. Enter two sides to find the third. Save calculation history. Share complete solutions. Support for entering fractions. No advertisements.
Measure by analyzing sound input. Select cylinder count and type. Calculate RPM using signal processing. Display real-time RPM values. Save and share measurement data.
Track behaviors, note triggers, and record observations
Track and record behavioral observations using structured templates. Input antecedents, behaviors, and consequences. Generate reports and analyze data trends. Export observations for review and sharing. Set reminders for consistent data collection.