The app displays ratio charts for five commodities including gold, silver, platinum, palladium, and crude oil. Users can compare two ratios on the same chart, viewing either absolute or percent values, with charts starting at 100% in percent mode.
by David Weber★ 4.73 ratingsFinanceFreeData updated 2026-09-17
Manage personal finances and DeFi investments with a . Adjust time periods and set tax rates for precise calculations. View pie and line charts to analyze investment breakdowns and compare simple versus over time.
The app simplifies expense tracking by allowing users to record spending projects. It presents consumption ratios through bar charts, eliminating the need for tedious bookkeeping and complex relationship management between income and spending.
AI Chart Analysis provides instant technical insights by analyzing uploaded chart screenshots. Identify trends, patterns, and candlestick structures. Access professional TradingView charts for crypto, forex, stocks, and commodities.
Track real-time quotes for US, Canadian, and Australian markets. Monitor global currency exchange rates and commodity prices like gold and oil. Create custom watchlists and view data offline. Switch between black and white layouts.
Trade securities with real-time market quotes and fast-loading intraday and historical charts. Create custom and smart watch lists to track favorite stocks. Analyze market trends using watch-list charts with volume and percentage change data.
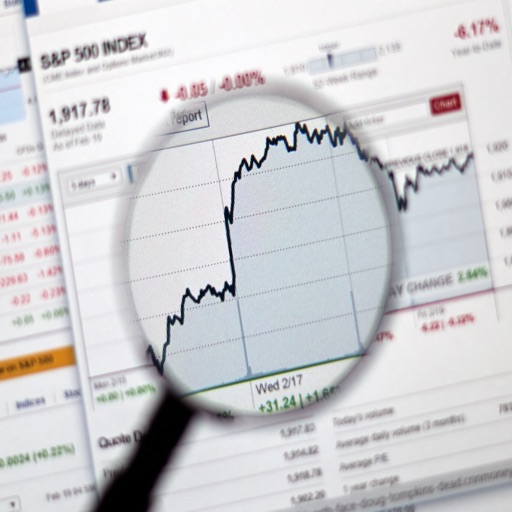
The app provides a summary of global markets performance. Users can see what is happening in markets across the world with a performance map and table.
View real-time prices with live updates and detailed charts. Calculate value based on karat type. Track changes and access historical data for informed decisions.
Monitor account metrics and review trading performance. Access live prices, trend lines, and technical charts. View market sentiment and receive breaking news updates. Analyze performance data and track progress over time.
Allows users to calculate compressor processes, including overall and stage compression ratios. It includes 19 calculators and data charts for design, operation, fabrication, and maintenance of diaphragm compressors.
Receive daily free trading signals with buy/sell entry points. Signals are based on technical analysis of 4-hour and daily charts, including pivot break points.