The app displays ratio charts for five commodities including gold, silver, platinum, palladium, and crude oil. Users can compare two ratios on the same chart, viewing either absolute or percent values, with charts starting at 100% in percent mode.
by David Weber★ 4.73 ratingsFinanceFreeData updated 2026-09-17
Trade financial instruments including currencies, commodities, metals, stocks, indices, cryptocurrencies, and options. Place market and limit orders, set stop-loss and take-profit levels.
Analyze financial charts with technical indicators and AI-driven signals. Identify entry and exit points using machine learning models. View real-time market data and historical trends. Save time with automated insights and customizable alerts.
Calculate points to identify support and resistance levels for financial instruments. Input high, low, and close prices to determine Resistance 4, Resistance 3, Resistance 2, Resistance 1, , Support 1, Support 2, Support 3, and Support 4 values.
Open a and manage trades, investments, and portfolio from a single platform. Place orders for stocks, commodities, futures, options, and ETFs. Track portfolio performance, set up alerts, and access real-time market data.
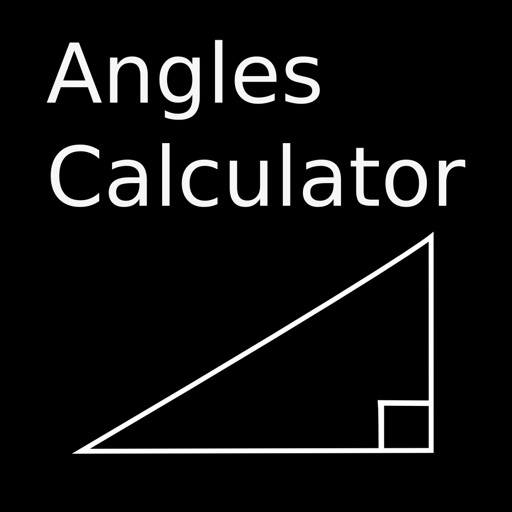
Calculate and side lengths of right angle triangles using sine, cosine, and tangent. Input known values to determine missing measurements. Explain calculation steps and rules for applying trigonometric ratios.
The app offers data on ISO-Tolerances, Threads, Cutting Data, Wrench Size, and Roughness. It includes charts for linear dimensions, radii, chamfer, and angular dimensions, along with symbols and explanations for geometrical tolerances.
Track stock performance with real-time data and analysis. Use a stock screener to filter investments based on value metrics. Calculate fair value and relative value of stocks. Monitor dividend flows and capital gains.
Upload charts for instant AI to identify trends, patterns, and outliers. Ask follow-up questions via AI chat to clarify insights and make -driven decisions.