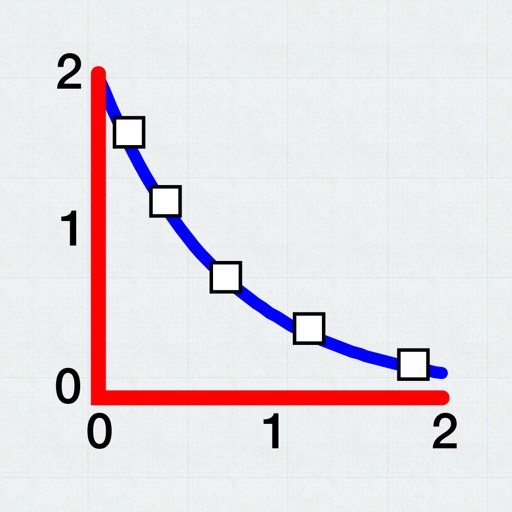
Allows users to plot and fit x, y data pairs. It supports curve fitting, value prediction, and kinetic data analysis. Data can be entered manually or imported from text or CSV files. Users can perform statistical analysis and generate graphs.
by Evan Kantrowitz★ 4.1106 ratingsProductivityFreeData updated 2026-09-08
The app offers six calculator types including graphing, handwriting, and scientific functions. It displays equations and results simultaneously, supporting equation solving and graph plotting.
Collect and analyze data from up to six sensors at once. Perform statistical analysis on full or selected datasets. Choose from ten curve fitting functions to plot and display formulas. Show error bars based on sensor specs or trial statistics.
The app provides machining math and reference solutions for design, layout, and production setup. It offers calculations for speeds and feeds, thread sizes, drill sizes, and trigonometric functions.
The app connects to the Enforcer load-cell to plot force in real time and download recordings. It allows for data processing via email or cloud services and includes an audible alarm.
Access formulas for Physics, Chemistry, and Maths including Algebra, Analytical geometry, and Differential equations. Search and locate formulas quickly. Sync across iOS devices with device-specific UI. Update content regularly with new formulas.
Study SAT with 1,500+ practice questions and detailed explanations. Set personalized study goals and track progress. Access updated questions aligned with guidelines. Review explanations and practice for math, reading, and writing sections.
Record and visualize physical phenomena using smartphone or tablet sensors. Measure sound, motion, light, and temperature. Connect external sensors like micro:bit and Arduino for advanced experiments.
Scientific calculator allows complex equation solving, graphing in portrait and landscape modes, and polynomial root finding up to 10th degree. Adjust font sizes and graph line widths. Solve systems of equations and matrices.
Calculate with scientific precision and enhanced functions
Simulate the HP-45 scientific calculator with photo-realistic visuals and original LED or LCD display. Print calculations, animate keys with sound and feedback, and replicate the calculator's computation times.
Calculate decayed activity using mCi or Bq units. View decay charts with tap-to-examine features and customizable input parameters. Save chart snapshots to camera roll. Estimate dose rates for isotopes as point sources at specified distances.
Perform statistical tests, regression analysis, and text analysis on various data formats. Generate graphs and tables for t-tests, ANOVA, linear regression, and survival analysis. Visualize text data with cloud charts for customer feedback.
Control Arduino pins digitally and analogously via Bluetooth Low Energy. Plot data in real time and log it to CSV files. Capture GPS coordinates during data collection. Communicate via serial text using a terminal interface.
Estimate relationships between variables using regression.
The app estimates the relationship between an independent variable and a dependent variable using ordinary least squares. It calculates the coefficient of determination to express the goodness of fit for the data.